New York City held onto its position as the second most expensive rental market in the nation throughout the entirety of 2017, with fairly flat rent growths for both bedroom types all year. Last month, the city had one bedrooms priced at $2,870, down 3.7% since this time last year, and two bedrooms at $3,230, down 5%.
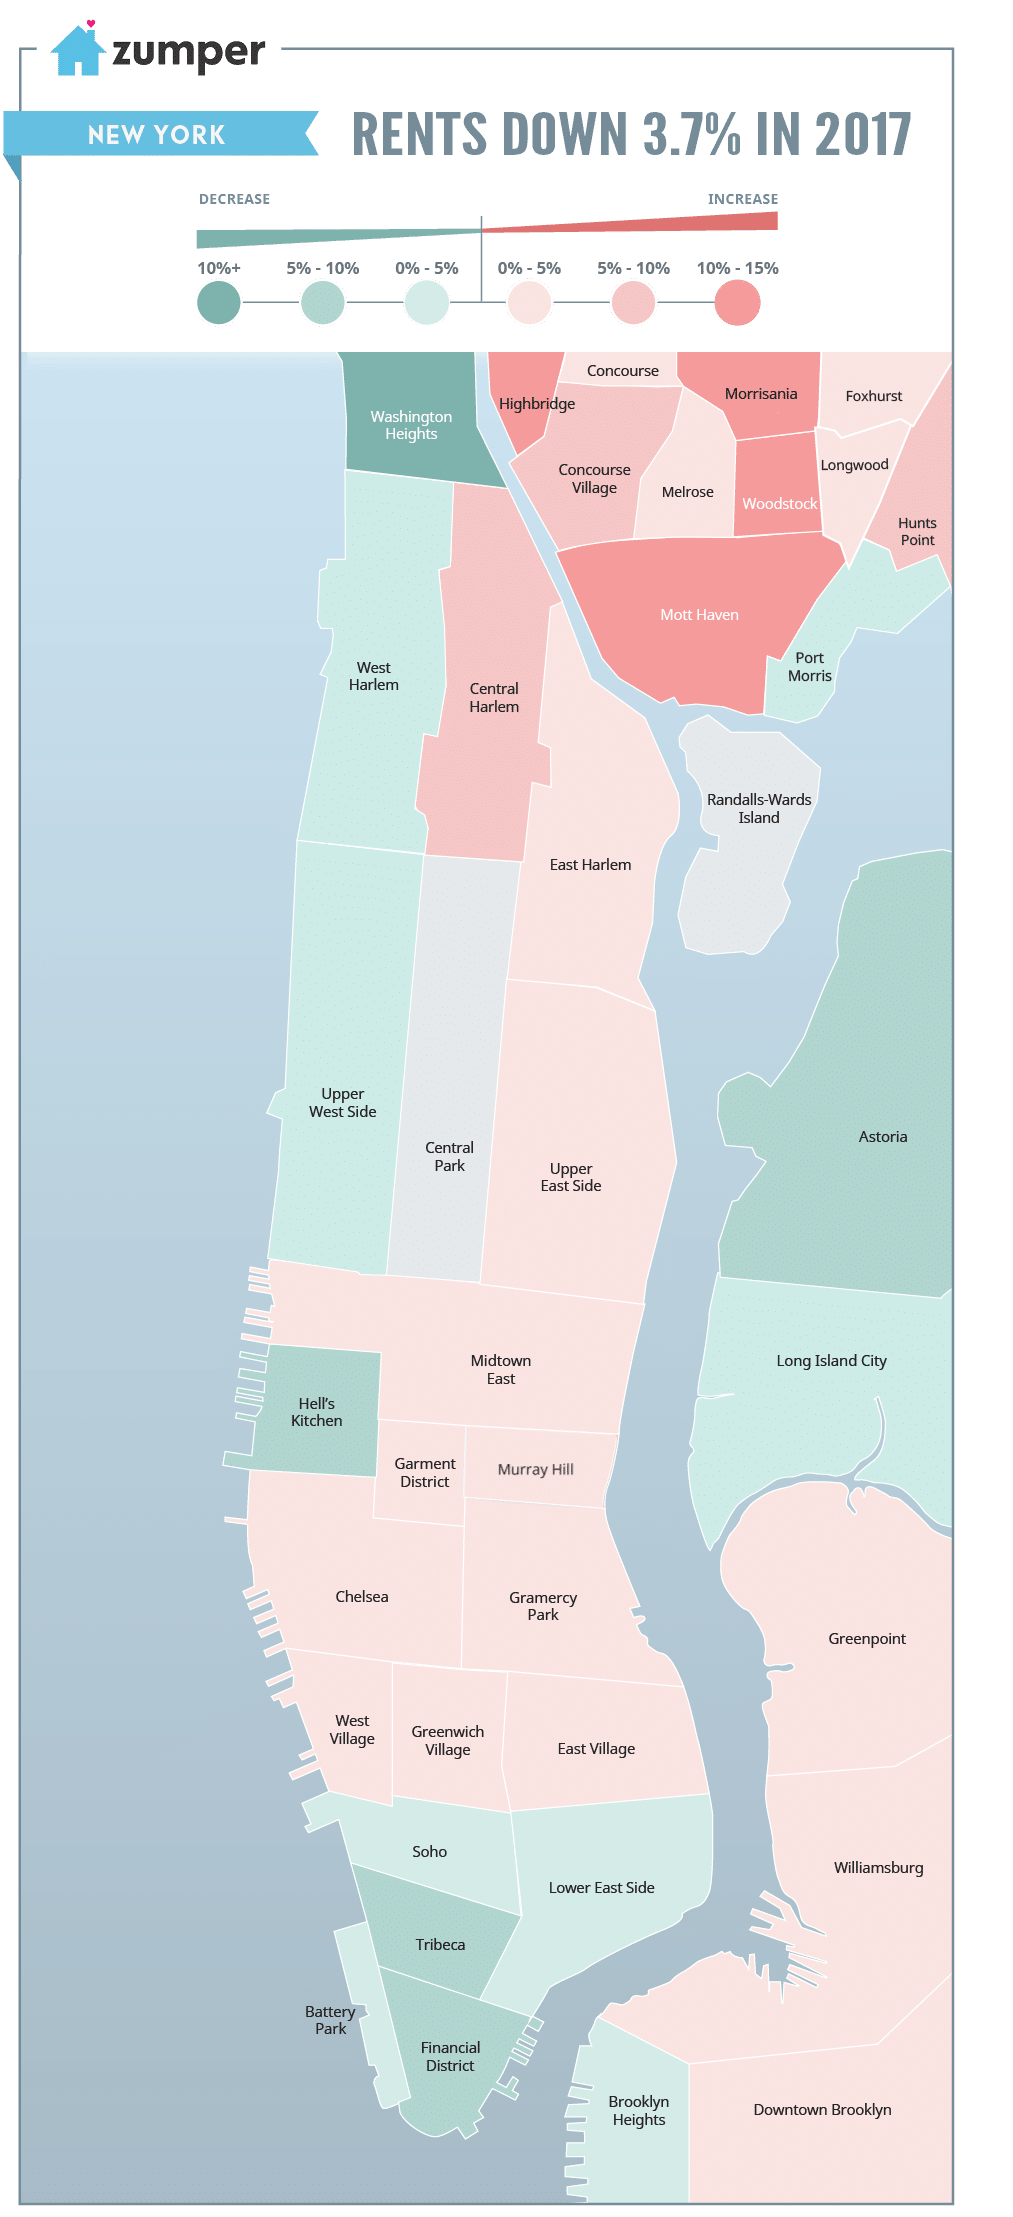
Manhattan & Bronx
The majority of Bronx neighborhoods on our map saw rents grow this year with Highbridge (+22%), Mott Haven (+15%), and Woodstock (+15%) leading the way with the largest spikes. The only area that saw rent decrease slightly was Port Morris, down about 4% since this time last year.
On Manhattan, only Central Harlem (+6%) had rent growing more than 5%. In terms of rent dips, Hell’s Kitchen (-9%), Tribeca (-6%), and Financial District (-5%) saw the biggest of those.
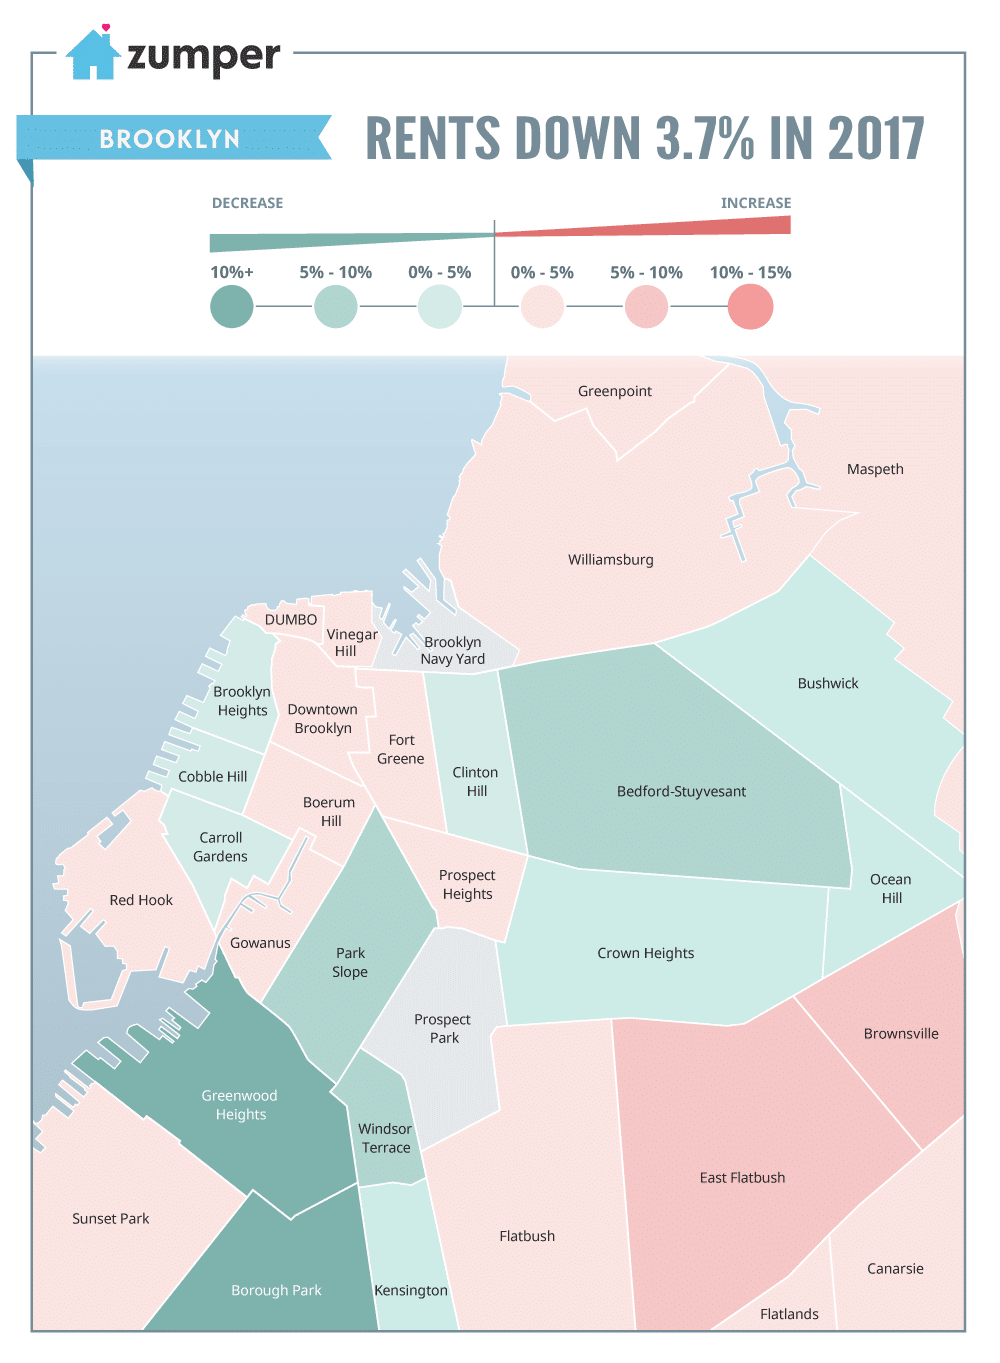
Brooklyn
The Brooklyn neighborhoods with the fastest growing prices this year were East Flatbush (+7%), Brownsville (+5%), and Williamsburg (+5%). However, the downward rent trends were much larger than the upwards, with Windsor Terrace, Greenwood Heights, and Borough Park all falling around 13%.
Full Data
| 1 Bedroom | 2 Bedrooms | ||||||
|---|---|---|---|---|---|---|---|
| Pos. | City | Price | M/M % | Y/Y % | Price | M/M % | Y/Y % |
| 1 | |||||||
| 2 | |||||||
| 3 | |||||||
| 4 | |||||||
| 5 | |||||||
| 6 | |||||||
| 7 | |||||||
| 8 | |||||||
| 9 | |||||||
| 10 | |||||||
| 11 |
If you’re interested in seeing how New York City rent prices compare with the rest of the nation’s, view our January National Rent Report, which analyzes over 1 million active listings available in the month prior to publication.
Want to keep track of rental trends? Follow us on Facebook, Gazouillement, ou Pinterest. In the market for a new place? Search over 73,800 NYC apartments for rent on Zumper now.
Contenu associé