As Manhattan prices continue to get more expensive and grow at some of the fastest rates in New York, other boroughs have begun to sprout new and alluring amenities, often at a fraction of the cost, so demand in what used to be the less popular boroughs have actually outpaced Manhattan significantly. This post uses our data to give some perspective on how renters are prioritizing New York boroughs as they search for apartments.
Demand Growth
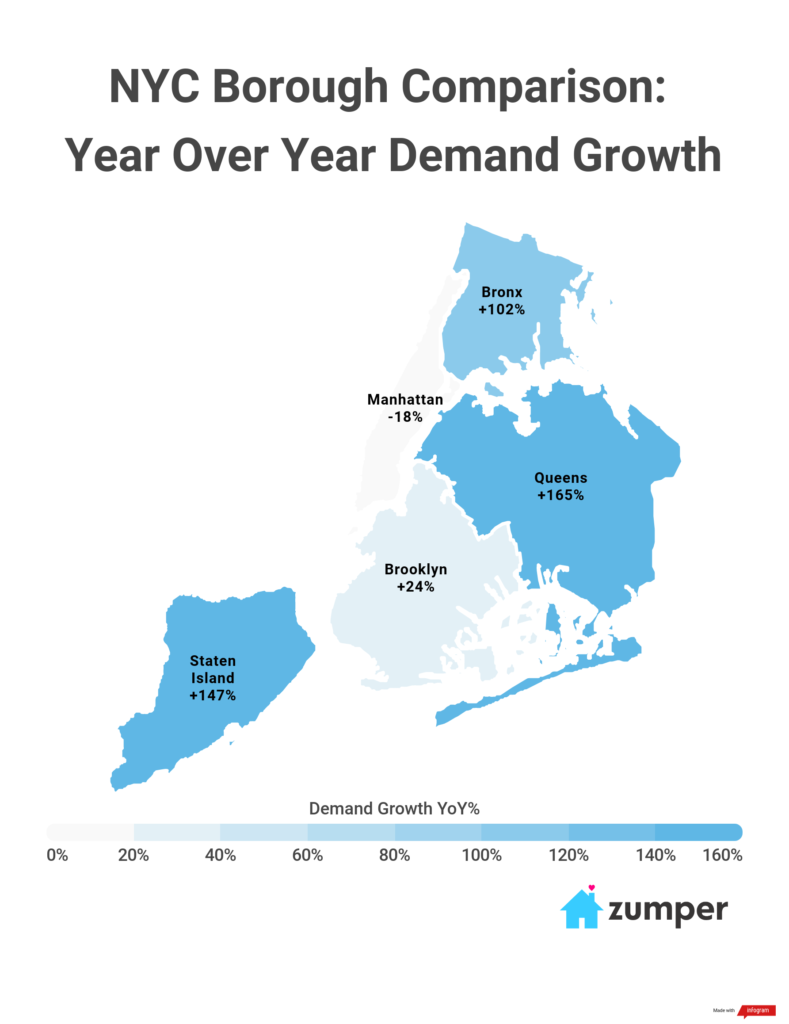
Queens had the most demand growth, which we defined as the total number of messages sent to listings, up 165% from 2018 to 2019. Staten Island followed suit as the second highest in demand with messages shooting up 147%. However, it is good to note that Staten Island had the least amount of listings since it’s the smallest geographically, so it is more sensitive to changes in comparison to the other boroughs. Bronx’s demand was also up over 100%, while Brooklyn’s year-over-year demand rate was 24%.
Manhattan was the only borough that saw demand actually decrease, down 18% year-over-year. As other boroughs are sprouting new apartment buildings with great amenities that are close to transportation into Manhattan, renters seem to be flocking to the more affordable boroughs.
Borough Migration Patterns
Overall, New Yorkers made up the majority of people searching for apartments in each of the boroughs, though neighboring Newarkers seem to be interested in moving into the area as well. Manhattan had a standout as San Francisco made it into one of the top 5 places where people were searching for Manhattan apartments.
The list below shows the top locations of renters who are searching for apartments in each borough.
Bronx
- Manhattan
- Bronx
- Newark (NJ)
- Hicksville
- Brooklyn
Brooklyn
- Manhattan
- Brooklyn
- Newark (NJ)
- Hicksville
- Bronx
Manhattan
- Manhattan
- Bronx
- Brooklyn
- Newark (NJ)
- San Francisco
Queens
- Manhattan,
- Newark (NJ)
- Brooklyn
- Bronx
- Hicksville
Staten Island
- Manhattan,
- Staten Island
- Newark (NJ)
- Brooklyn
- Bronx
Rent Growth
Manhattan and Staten Island were tied for the borough with the largest year-over-year one-bedroom rental growth rate, both up 6%. Brooklyn and Queens followed suit with the next largest growth rates, climbing 3% and 2%, respectively. Bronx was the only borough with a downward rental trend, falling 2% year-over-year.
While Manhattan was the only borough with a drop in demand, prices still managed to grow from the previous year. Though this does highlight the hot rental market in Manhattan, it also exemplifies why there is so much demand growth in the other boroughs as well. Manhattan one-bedroom rent is still hundreds of dollars more expensive a month, and in some cases over a thousand dollars more a month, when compared to the other boroughs so people seem to think living further away from the city center but getting relief in rent is worth it.
Full Data
| NYC Borough | 2018 1-bed rent | 2019 1-bed rent | Price YoY% | Leads YoY% |
|---|---|---|---|---|
| Bronx | $1,765 | $1,722 | -2% | 102% |
| Brooklyn | $2,062 | $2,128 | 3% | 24% |
| Manhattan | $2,845 | $3,018 | 6% | -18% |
| Queens | $1,796 | $1,834 | 2% | 165% |
| Staten Island | $1,576 | $1,664 | 6% | 147% |
Méthodologie
Using data on Zumper.com we looked at demand, which we defined as total number of messages sent to listings, one-bedroom median rent prices, and search patterns for each NYC borough. We compared data from the entirety of 2018 with data from the entirety of 2019 to gather year over year growth rates. The NYC boroughs we looked at are available in the “Full Data” table.
Contenu associé