The Zumper Minneapolis Metro Report analyzed active listings in June across 13 metro cities to show the most and least expensive cities and cities with the fastest growing rents.
Cities Ranked By Rent
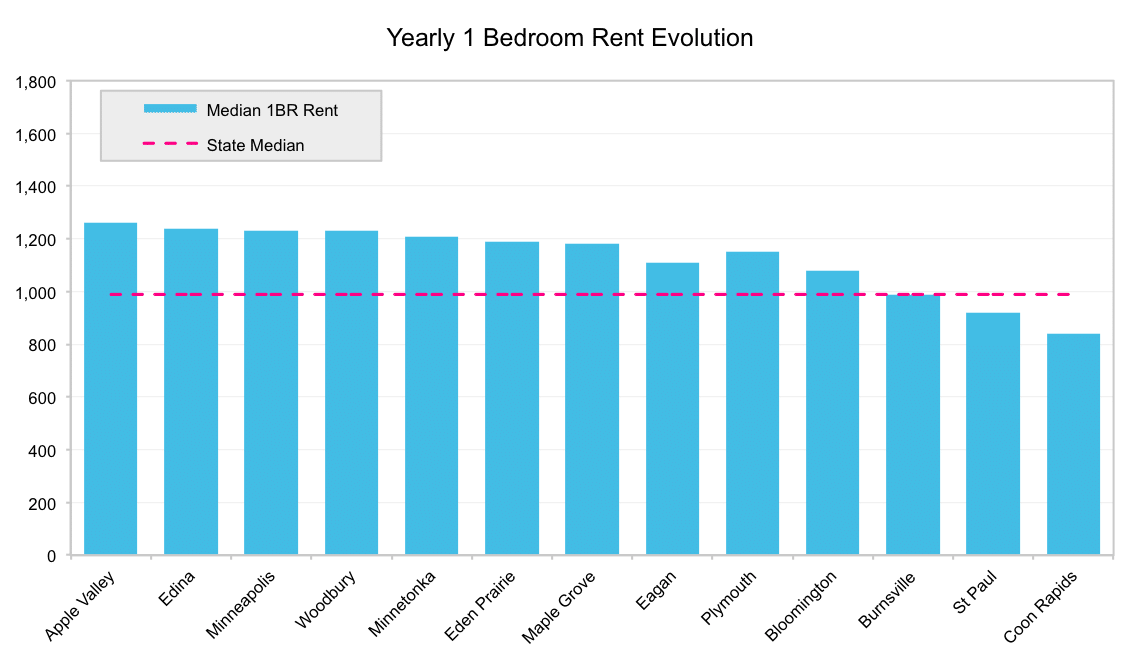
The Most Expensive
–Apple Valley, MN stayed the most expensive city to rent in the metro. One bedroom units were priced at a median of $1,260.
–Edina, MN prices were slightly down. The median rent price for one bedroom units was $1,240.
–Woodbury & Minneapolis, MN were tied for third with median rent at $1,230.
The Least Expensive
–Coon Rapids, MN stayed the most affordable city with a median rent of $840.
–St. Paul, MN rent grew slightly to $920, but remained the second most affordable city on the list.
–Burnsville, MN kept its ranking as well. One bedroom units were priced at a median of $990.
Growth Rate
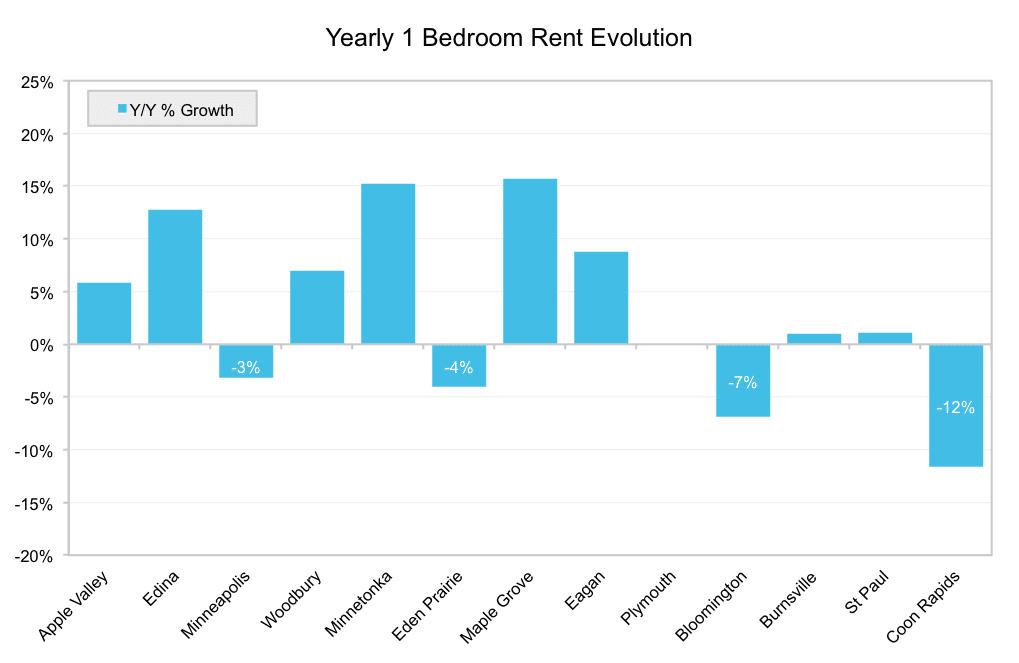
The Fastest Growing (Y/Y%)
–Maple Grove, MN rent was the fastest-growing year over year, up 15.7% since this time last June.
–Minnetonka, MN was second with a 15.2% yearly growth rate.
–Edina, MN rent climbed by 12.7% this year, making it the third fastest-growing.
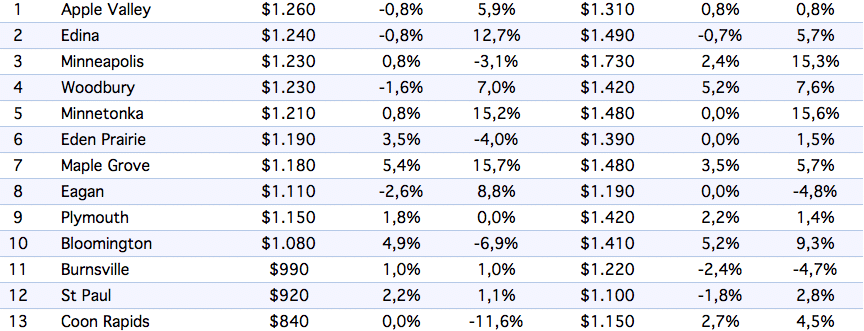
The Fastest Growing (M/M%)
–Maple Grove, MN rent climbed 5.4%, experiencing the largest monthly growth rate.
–Bloomington, MN rent followed behind with a 4.9% monthly growth rate.
–Eden Prairie, MN ranked rent was up by 3.5% compared to last month.
Full Data
| 1 Bedroom | 2 Bedrooms | |||||||
|---|---|---|---|---|---|---|---|---|
| Pos. | +/- | City | Price | M/M % | Y/Y % | Price | M/M % | Y/Y % |
| 1 | 0 | San Francisco, Californie | $3.420 | -0,9% | -1,2% | $4.500 | 0,0% | -6,1% |
| 2 | 0 | New York, NY | $2.940 | -0,3% | -8,1% | $3.300 | -1,5% | -6,8% |
| 3 | 0 | San Jose, CA | $2.380 | -0,4% | 7,2% | $2.820 | -0,4% | -2,1% |
| 4 | 1 | Boston, Massachusetts | $2.200 | 0,0% | -1,3% | $2.650 | 0,8% | 4,7% |
| 4 | 0 | Washington, D.C. | $2.200 | -0,5% | 2,8% | $3.150 | -4,3% | 5,7% |
| 6 | 0 | Los Angeles, Californie | $2.150 | 2,4% | 8,0% | $3.100 | 3,3% | 2,6% |
| 7 | -1 | Oakland, CA | $2.130 | 1,4% | -3,6% | $2.530 | 1,2% | -7,3% |
| 8 | 0 | Seattle, WA | $1.940 | 1,6% | 7,2% | $2.480 | -0,8% | 4,2% |
| 9 | 0 | Honolulu, HI | $1.800 | 0,0% | 0,6% | $2.190 | -4,8% | -13,1% |
| 9 | 0 | Miami, Floride | $1.800 | 0,0% | -3,7% | $2.450 | -2,0% | -2,4% |
| 11 | 1 | San Diego, CA | $1.600 | 1,3% | 5,3% | $2.270 | 3,2% | 7,6% |
| 12 | -1 | Chicago, Illinois | $1.590 | -4,8% | -10,7% | $2.140 | -0,5% | -15,1% |
| 13 | 0 | Fort Lauderdale, FL | $1.560 | 1,3% | -1,3% | $1.900 | 0,0% | -5,0% |
| 14 | 1 | Philadelphie, Pennsylvanie | $1.400 | 0,7% | 5,3% | $1.600 | 0,6% | 8,1% |
| 15 | -1 | Long Beach, CA | $1.390 | -0,7% | 15,8% | $1.870 | 2,2% | 8,7% |
| 16 | 1 | Providence, RI | $1.360 | 0,7% | -9,3% | $1.430 | 1,4% | -12,8% |
| 17 | -1 | Portland, Oregon | $1.350 | -0,7% | -3,6% | $1.590 | -0,6% | -4,2% |
| 18 | 0 | Baltimore, MD | $1.340 | 0,8% | 13,6% | $1.450 | -1,4% | 6,6% |
| 19 | 2 | Atlanta, Géorgie | $1.310 | 4,0% | 0,8% | $1.660 | 3,8% | 0,6% |
| 20 | 0 | Dallas, Texas | $1.300 | 1,6% | 3,2% | $1.800 | 2,9% | 6,5% |
| 20 | 2 | Denver, Colorado | $1.300 | 4,8% | 8,3% | $1.850 | 2,8% | 12,1% |
| 22 | -4 | New Orleans, LA | $1.260 | -5,3% | -1,6% | $1.600 | 0,0% | 0,0% |
| 23 | 0 | Minneapolis, MN | $1.200 | -2,4% | -4,0% | $1.690 | -2,3% | 9,0% |
| 23 | 4 | Pittsburgh, PA | $1.200 | 5,3% | 10,1% | $1.370 | -4,9% | 7,9% |
| 25 | 1 | Nashville, TN | $1.190 | 3,5% | 15,5% | $1.410 | 0,7% | 10,2% |
| 26 | -1 | Madison, WI | $1.180 | 0,9% | 6,3% | $1.230 | 0,8% | -11,5% |
| 27 | 4 | Irving, TX | $1.150 | 3,6% | 15,0% | $1.420 | 1,4% | 14,5% |
| 27 | -3 | Scottsdale, AZ | $1.150 | -4,2% | 4,5% | $2.000 | 0,0% | 5,3% |
| 29 | 0 | Charlotte, Caroline du Nord | $1.140 | 0,9% | 15,2% | $1.230 | -4,7% | 8,8% |
| 30 | 2 | Plano, TX | $1.130 | 4,6% | 4,6% | $1.490 | 2,8% | 5,7% |
| 31 | -2 | Houston, Texas | $1.120 | -0,9% | 15,5% | $1.380 | -3,5% | 13,1% |
| 31 | -4 | Sacramento, CA | $1.120 | -1,8% | 15,5% | $1.240 | -0,8% | 15,9% |
| 33 | 2 | Austin, Texas | $1.080 | 3,8% | -2,7% | $1.380 | 4,5% | -4,2% |
| 33 | -1 | Orlando, Floride | $1.080 | 0,0% | 10,2% | $1.250 | -1,6% | 7,8% |
| 35 | -1 | Tampa, Floride | $1.070 | 1,9% | 15,1% | $1.260 | 2,4% | 14,5% |
| 36 | 2 | Gilbert, AZ | $1.040 | 5,1% | 7,2% | $1.340 | 0,0% | 6,3% |
| 37 | -1 | Raleigh, NC | $1.030 | 3,0% | 9,6% | $1.160 | 0,9% | 10,5% |
| 38 | 2 | Virginia Beach, VA | $1.020 | 5,2% | 12,1% | $1.200 | 1,7% | 1,7% |
| 39 | -3 | Aurora, CO | $1.000 | 0,0% | 6,4% | $1.390 | 1,5% | 6,9% |
| 39 | 5 | Richmond, VA | $1.000 | 4,2% | 11,1% | $1.200 | 0,0% | 11,1% |
| 41 | -1 | Durham, NC | $980 | 1,0% | 15,3% | $1.130 | 0,9% | 13,0% |
| 41 | -1 | Newark, NJ | $980 | 1,0% | 15,3% | $1.200 | 0,0% | 0,0% |
| 43 | 1 | Chandler, AZ | $970 | 1,0% | 3,2% | $1.180 | 1,7% | 5,4% |
| 44 | 3 | Fort Worth, TX | $950 | 3,3% | 15,9% | $1.140 | 3,6% | 15,2% |
| 44 | -5 | Henderson, NV | $950 | -3,1% | 9,2% | $1.090 | -1,8% | 0,9% |
| 46 | 1 | Buffalo, NY | $940 | 2,2% | 11,9% | $1.300 | 0,0% | 14,0% |
| 47 | -7 | Chesapeake, VA | $920 | -5,2% | -6,1% | $1.190 | 3,5% | 0,8% |
| 48 | 1 | Salt Lake City, UT | $900 | 0,0% | 15,4% | $1.180 | -1,7% | 15,7% |
| 48 | -2 | St Petersburg, FL | $900 | -5,3% | 9,8% | $1.390 | -2,8% | 2,2% |
| 50 | 3 | Jacksonville, FL | $880 | 1,1% | 2,3% | $1.070 | -2,7% | 3,9% |
| 51 | -2 | Corpus Christi, TX | $870 | -3,3% | -2,2% | $1.000 | 0,0% | -4,8% |
| 51 | 1 | Phoenix, Arizona | $870 | -1,1% | 4,8% | $1.100 | 1,9% | 10,0% |
| 53 | -4 | Anchorage, AK | $860 | -4,4% | -5,5% | $1.200 | 0,0% | 4,3% |
| 54 | 2 | Kansas City, MO | $840 | 2,4% | 13,5% | $1.000 | -1,0% | 14,9% |
| 55 | 7 | Des Moines, IA | $830 | 5,1% | 15,3% | $910 | 2,2% | 4,6% |
| 55 | 0 | Fresno, CA | $830 | -2,4% | 10,7% | $1.000 | 0,0% | 11,1% |
| 55 | 1 | San Antonio, TX | $830 | 1,2% | -2,4% | $1.040 | 0,0% | -4,6% |
| 55 | 7 | Syracuse, NY | $830 | 5,1% | 3,8% | $1.000 | 1,0% | -3,8% |
| 59 | -5 | Boise, ID | $820 | -4,7% | 6,5% | $900 | 1,1% | 9,8% |
| 59 | 3 | Lexington, KY | $820 | 3,8% | 6,5% | $930 | -1,1% | -1,1% |
| 61 | -3 | Las Vegas, Nevada | $810 | 1,3% | 3,8% | $1.000 | 2,0% | 8,7% |
| 61 | 1 | Louisville, KY | $810 | 2,5% | 14,1% | $850 | 2,4% | 9,0% |
| 61 | -3 | Mesa, AZ | $810 | 1,3% | 9,5% | $950 | -3,1% | 0,0% |
| 64 | -6 | Baton Rouge, LA | $800 | 0,0% | 1,3% | $910 | -1,1% | 2,2% |
| 65 | 1 | Colorado Springs, CO | $790 | 1,3% | 3,9% | $1.100 | 0,0% | 7,8% |
| 65 | -7 | Milwaukee, WI | $790 | -1,3% | -2,5% | $960 | -1,0% | 5,5% |
| 67 | 0 | Omaha, NE | $780 | 1,3% | 2,6% | $950 | 3,3% | -3,1% |
| 68 | 4 | Knoxville, TN | $750 | 5,6% | 1,4% | $800 | -2,4% | -3,6% |
| 69 | 3 | Reno, NV | $730 | 2,8% | 15,9% | $1.060 | 1,9% | 14,0% |
| 69 | 0 | Rochester, NY | $730 | 0,0% | 7,4% | $880 | 1,1% | 10,0% |
| 71 | -3 | Laredo, TX | $720 | -4,0% | -7,7% | $890 | 4,7% | 1,1% |
| 71 | 0 | Norfolk, VA | $720 | 0,0% | 2,9% | $900 | 0,0% | 5,9% |
| 73 | 6 | Arlington, TX | $700 | 2,9% | -2,8% | $940 | 2,2% | 1,1% |
| 73 | -4 | Bakersfield, CA | $700 | -4,1% | 2,9% | $900 | 0,0% | 13,9% |
| 73 | 2 | St Louis, MO | $700 | 0,0% | 4,5% | $1.020 | 2,0% | 9,7% |
| 76 | 3 | Cleveland, OH | $690 | 1,5% | 15,0% | $780 | 1,3% | -1,3% |
| 77 | 5 | Chattanooga, TN | $680 | 3,0% | -11,7% | $770 | 1,3% | -15,4% |
| 77 | -2 | Columbus, Ohio | $680 | -2,9% | 15,3% | $920 | -4,2% | 4,5% |
| 77 | 1 | Glendale, AZ | $680 | -1,4% | 4,6% | $900 | 0,0% | -2,2% |
| 77 | 7 | Spokane, WA | $680 | 4,6% | 9,7% | $820 | -4,7% | 6,5% |
| 81 | -9 | Cincinnati, OH | $670 | -5,6% | 15,5% | $970 | 5,4% | 15,5% |
| 81 | -6 | Lincoln, NE | $670 | -4,3% | -4,3% | $830 | -4,6% | -9,8% |
| 83 | -4 | Winston Salem, NC | $660 | -2,9% | 11,9% | $730 | 2,8% | 0,0% |
| 84 | 6 | El Paso, TX | $650 | 4,8% | 1,6% | $750 | 0,0% | -2,6% |
| 84 | 2 | Memphis, TN | $650 | 1,6% | 8,3% | $680 | 1,5% | 0,0% |
| 84 | 2 | Tucson, AZ | $650 | 1,6% | 12,1% | $850 | 0,0% | 3,7% |
| 87 | 3 | Albuquerque, NM | $630 | 1,6% | 1,6% | $800 | 2,6% | -3,6% |
| 87 | -3 | Augusta, GA | $630 | -3,1% | -3,1% | $780 | 0,0% | 0,0% |
| 87 | -5 | Greensboro, NC | $630 | -4,5% | -6,0% | $820 | 1,2% | 13,9% |
| 87 | 1 | Oklahoma City, OK | $630 | 0,0% | -1,6% | $780 | 4,0% | 0,0% |
| 87 | 1 | Tallahassee, FL | $630 | 0,0% | -3,1% | $770 | 0,0% | 2,7% |
| 92 | 0 | Indianapolis, IN | $600 | 0,0% | 5,3% | $700 | -1,4% | 2,9% |
| 92 | 1 | Tulsa, OK | $600 | 1,7% | 7,1% | $750 | 2,7% | 1,4% |
| 94 | 1 | Lubbock, TX | $570 | 3,6% | 1,8% | $750 | 0,0% | -6,3% |
| 95 | -1 | Shreveport, LA | $560 | 0,0% | 0,0% | $650 | 0,0% | -8,5% |
| 96 | 0 | Akron, OH | $530 | -1,9% | 3,9% | $650 | -3,0% | -4,4% |
| 96 | 2 | Detroit, MI | $530 | 0,0% | -3,6% | $600 | 0,0% | -7,7% |
| 96 | 0 | Wichita, KS | $530 | -1,9% | 10,4% | $650 | -1,5% | 6,6% |
| 99 | 0 | Fort Wayne, IN | $480 | 2,1% | -2,0% | $590 | 0,0% | 5,4% |
| 100 | 0 | Toledo, OH | $470 | 4,4% | 9,3% | $590 | 5,4% | 5,4% |
About
The Zumper Minneapolis Metro Report analyzed active listings that hit the market in June 2017. Listings are aggregated by city to calculate median asking rents.
In the market for a new place? Search all Minneapolis apartments for rent on Zumper now.
Stay up to date with Zumper by following us on Facebook, Gazouillement, Instagram, & Pinterest.
Contenu associé