The Zumper Minneapolis Metro Report analyzed over 7,000 active listings in March across 13 metro cities to show the most and least expensive cities and cities with the fastest growing rents.
Cities Ranked By Rent
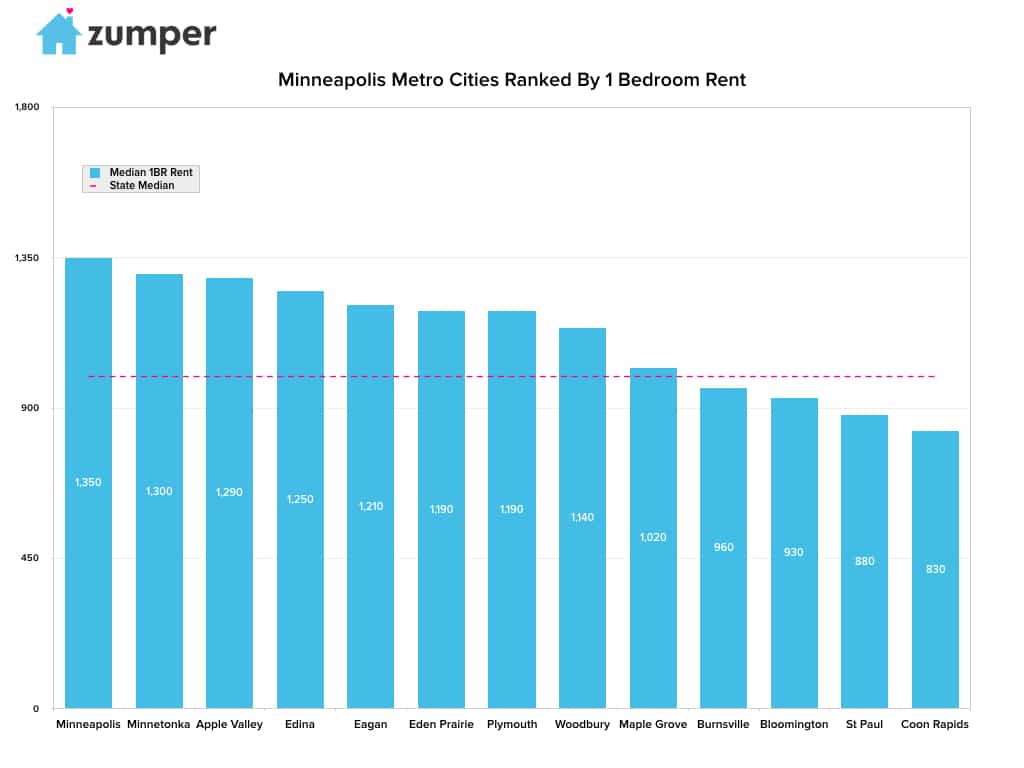
Most Expensive
–Minneapolis, MN had the most expensive rent in the metro area this month at $1,350.
–Minnetonka, MN was the second priciest city with one bedroom units at a median of $1,300.
–Apple Valley, MN followed closely behind with rent at $1,290.
Least Expensive
–Coon Rapids, MN was the most affordable city to rent with one bedroom units priced at $830.
–St. Paul, MN ranked as the second least expensive city with rent at $880.
–Bloomington, MN rent settled at $930 this month, making it the third most affordable city.
Yearly Growth Rate
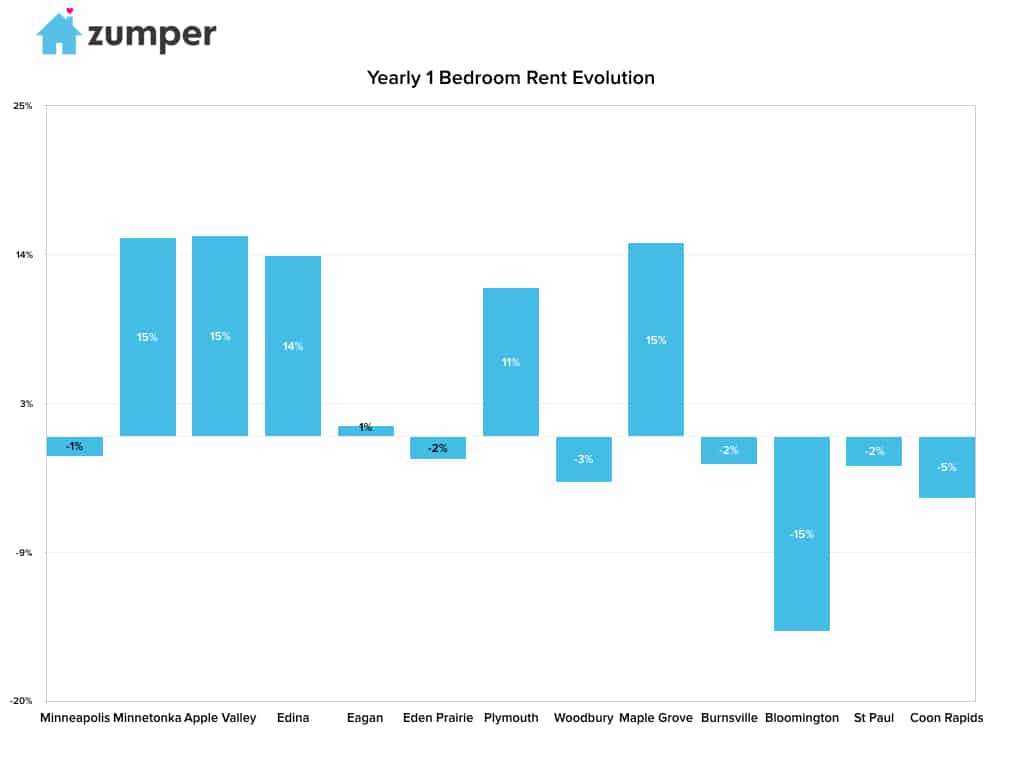
Fastest Growing
–Apple Valley, MN had the fastest growing rent, up 15.2% since this time last year.
–Minnetonka, MN followed very closely behind with a yearly growth rate of 15%.
–Maple Grove, MN rents ranked as third, growing 14.6%.
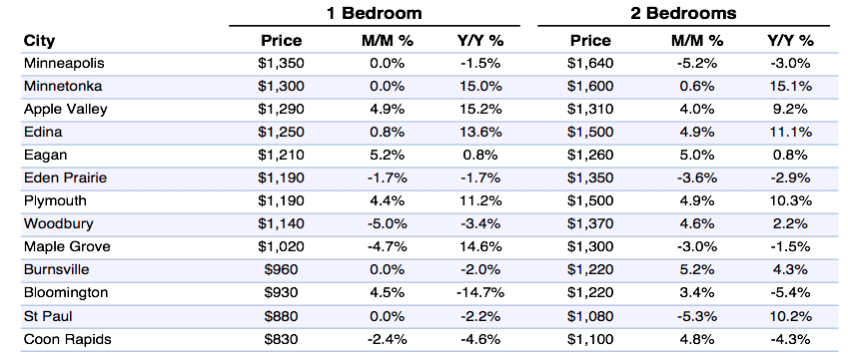
Full Data
| Pos. | +/- | City | Price (1 Bed) | M/M % | Y/Y % | Price (2 Bed) | M/M % | Y/Y % |
|---|---|---|---|---|---|---|---|---|
| 1 | 0 | San Francisco, Californie | $3,370 | 1.5% | -5.3% | $4,500 | 1.6% | -5.9% |
| 2 | 0 | New York, NY | $2,910 | -1.0% | -5.5% | $3,450 | -1.1% | -1.1% |
| 3 | 0 | San Jose, CA | $2,260 | 0.0% | -7.0% | $2,850 | 1.1% | -7.5% |
| 4 | 0 | Boston, Massachusetts | $2,200 | 0.0% | -3.5% | $2,600 | 0.0% | -2.6% |
| 5 | 1 | Los Angeles, Californie | $2,090 | 1.5% | 0.5% | $2,980 | 1.0% | 3.5% |
| 6 | -1 | Oakland, CA | $2,060 | -0.5% | -14.9% | $2,500 | -2.0% | -15.0% |
| 6 | 1 | Washington, D.C. | $2,060 | 1.0% | -7.2% | $3,040 | 4.8% | -0.7% |
| 8 | 0 | Seattle, WA | $1,850 | 2.2% | 1.6% | $2,450 | 2.1% | -7.5% |
| 9 | 0 | Miami, Floride | $1,800 | 0.0% | -4.8% | $2,510 | 0.4% | -4.2% |
| 9 | 1 | Honolulu, HI | $1,800 | 1.1% | -5.8% | $2,380 | -0.4% | -7.8% |
| 11 | 0 | Chicago, Illinois | $1,680 | -5.1% | -1.2% | $2,150 | -4.9% | -2.3% |
| 12 | 1 | Fort Lauderdale, FL | $1,590 | 1.3% | 6.0% | $1,950 | -1.5% | -7.6% |
| 12 | 0 | San Diego, CA | $1,590 | 0.6% | 6.0% | $2,160 | -1.8% | 6.4% |
| 14 | 3 | Long Beach, CA | $1,360 | 0.7% | 7.1% | $1,950 | 3.2% | 14.7% |
| 14 | 1 | Philadelphie, Pennsylvanie | $1,360 | -1.4% | 0.7% | $1,580 | -0.6% | 8.2% |
| 16 | -2 | Providence, RI | $1,350 | -2.9% | -10.0% | $1,410 | -4.7% | -4.1% |
| 17 | 2 | Portland, Oregon | $1,340 | 0.0% | 0.0% | $1,590 | -0.6% | -1.9% |
| 18 | 3 | Dallas, Texas | $1,320 | 0.0% | 6.5% | $1,800 | 0.6% | 9.1% |
| 19 | 1 | Atlanta, Géorgie | $1,300 | -2.3% | 3.2% | $1,620 | -3.6% | 3.8% |
| 20 | -4 | New Orleans, LA | $1,290 | -5.1% | 1.6% | $1,590 | 5.3% | 0.0% |
| 21 | -4 | Minneapolis, MN | $1,280 | -5.2% | -1.5% | $1,640 | 0.0% | -6.8% |
| 22 | 2 | Denver, Colorado | $1,250 | 3.3% | 4.2% | $1,700 | 1.2% | -3.4% |
| 22 | 0 | Scottsdale, AZ | $1,250 | -0.8% | 10.6% | $2,080 | -5.0% | 2.5% |
| 24 | 1 | Baltimore, MD | $1,210 | 5.2% | 10.0% | $1,390 | 5.3% | -0.7% |
| 25 | -2 | Nashville, TN | $1,180 | -3.3% | 14.6% | $1,310 | -0.8% | 5.6% |
| 26 | -1 | Charlotte, Caroline du Nord | $1,170 | 1.7% | 2.6% | $1,260 | -0.8% | 5.0% |
| 27 | -2 | Madison, WI | $1,150 | 0.0% | 0.0% | $1,240 | -1.6% | 0.0% |
| 28 | 1 | Irving, TX | $1,100 | 2.8% | 14.6% | $1,430 | 4.4% | 15.3% |
| 28 | 1 | Sacramento, CA | $1,100 | 2.8% | 7.8% | $1,300 | 3.2% | 15.0% |
| 30 | -5 | Houston, Texas | $1,090 | -5.2% | 5.8% | $1,360 | -4.9% | 4.6% |
| 31 | 3 | Orlando, Floride | $1,060 | 3.9% | 3.9% | $1,230 | 2.5% | 3.4% |
| 31 | 0 | Plano, TX | $1,060 | 0.0% | 1.0% | $1,430 | 0.0% | 2.9% |
| 33 | -1 | Austin, Texas | $1,050 | 0.0% | -7.1% | $1,340 | 0.8% | -9.5% |
| 34 | -1 | Pittsburgh, PA | $1,040 | 0.0% | -5.5% | $1,310 | 0.8% | -3.0% |
| 35 | 1 | Gilbert, AZ | $1,000 | -1.0% | 4.2% | $1,290 | 0.0% | -3.7% |
| 35 | 1 | Raleigh, NC | $1,000 | -1.0% | 12.4% | $1,200 | 4.3% | 15.4% |
| 37 | -3 | Aurora, CO | $990 | -2.9% | 6.5% | $1,360 | 0.0% | 8.8% |
| 37 | 2 | Richmond, VA | $990 | 1.0% | 13.8% | $1,140 | 3.6% | 14.0% |
| 37 | 1 | Tampa, Floride | $990 | -1.0% | 1.0% | $1,200 | -1.6% | 9.1% |
| 40 | 0 | Henderson, NV | $970 | 0.0% | 15.5% | $1,150 | 2.7% | 11.7% |
| 40 | 5 | Newark, NJ | $970 | 5.4% | 14.1% | $1,170 | 0.0% | 1.7% |
| 42 | 5 | Chesapeake, VA | $960 | 5.5% | -6.8% | $1,150 | 0.0% | -4.2% |
| 42 | -1 | Fort Worth, TX | $960 | 1.1% | 14.3% | $1,110 | 0.9% | 14.4% |
| 44 | -3 | Chandler, AZ | $940 | -1.1% | 6.8% | $1,160 | 0.9% | 5.5% |
| 45 | 5 | Buffalo, NY | $930 | 3.3% | -14.7% | $1,300 | 3.2% | 15.0% |
| 45 | -1 | Durham, NC | $930 | 0.0% | 9.4% | $1,080 | 4.9% | 8.0% |
| 47 | 4 | Salt Lake City, UT | $920 | 4.5% | 15.0% | $1,200 | 4.3% | 13.2% |
| 47 | -4 | Virginia Beach, VA | $920 | -2.1% | 4.5% | $1,150 | 0.0% | 0.0% |
| 49 | 4 | St Petersburg, FL | $900 | 4.7% | 5.9% | $1,490 | 4.9% | 14.6% |
| 50 | -3 | Anchorage, AK | $890 | -2.2% | -7.3% | $1,200 | 4.3% | 0.0% |
| 50 | 4 | Jacksonville, FL | $890 | 4.7% | 8.5% | $1,060 | -1.9% | 6.0% |
| 50 | 2 | Phoenix, Arizona | $890 | 2.3% | 9.9% | $1,100 | 4.8% | 5.8% |
| 53 | -8 | Kansas City, MO | $880 | -4.3% | 8.6% | $940 | 1.1% | 9.3% |
| 54 | -7 | Baton Rouge, LA | $860 | -5.5% | 2.4% | $990 | 4.2% | -1.0% |
| 55 | 2 | Boise, ID | $830 | 2.5% | 6.4% | $950 | 2.2% | 14.5% |
| 55 | 6 | Corpus Christi, TX | $830 | 5.1% | -3.5% | $1,000 | 4.2% | -8.3% |
| 55 | -1 | Fresno, CA | $830 | -2.4% | 7.8% | $950 | 0.0% | 8.0% |
| 58 | 0 | Louisville, KY | $820 | 2.5% | 3.8% | $880 | 4.8% | 12.8% |
| 58 | 0 | Milwaukee, WI | $820 | 2.5% | -3.5% | $900 | 4.7% | -15.1% |
| 58 | -2 | San Antonio, TX | $820 | -1.2% | -5.7% | $1,050 | -2.8% | -6.3% |
| 61 | 0 | Colorado Springs, CO | $800 | 1.3% | 5.3% | $1,100 | 4.8% | 14.6% |
| 61 | -3 | Lexington, KY | $800 | 0.0% | 11.1% | $930 | 0.0% | 8.1% |
| 63 | -2 | Mesa, AZ | $780 | -1.3% | 4.0% | $950 | -3.1% | 3.3% |
| 64 | -3 | Las Vegas, Nevada | $770 | -2.5% | 0.0% | $980 | 4.3% | 4.3% |
| 65 | 3 | Omaha, NE | $750 | 2.7% | 0.0% | $910 | 1.1% | -4.2% |
| 66 | 2 | Laredo, TX | $740 | 1.4% | -9.8% | $840 | -2.3% | -6.7% |
| 67 | 0 | Cincinnati, OH | $730 | -1.4% | 15.9% | $940 | -2.1% | 14.6% |
| 67 | 4 | Glendale, AZ | $730 | 4.3% | 7.4% | $900 | 2.3% | 1.1% |
| 67 | 3 | Rochester, NY | $730 | 2.8% | 10.6% | $850 | -3.4% | 13.3% |
| 67 | -2 | Syracuse, NY | $730 | -2.7% | -8.8% | $1,000 | 5.3% | -6.5% |
| 71 | 4 | Bakersfield, CA | $720 | 4.3% | 9.1% | $850 | 1.2% | 13.3% |
| 72 | -7 | Des Moines, IA | $710 | -5.3% | -15.5% | $810 | 0.0% | -4.7% |
| 72 | -1 | Reno, NV | $710 | 1.4% | 6.0% | $1,050 | 4.0% | 9.4% |
| 74 | 3 | St Louis, MO | $700 | 2.9% | 2.9% | $1,000 | 5.3% | 13.6% |
| 75 | -4 | Chattanooga, TN | $690 | -1.4% | -9.2% | $750 | 4.2% | -11.8% |
| 75 | 5 | Norfolk, VA | $690 | 4.5% | 1.5% | $900 | 0.0% | 5.9% |
| 77 | -6 | Arlington, TX | $680 | -2.9% | -6.8% | $930 | 1.1% | -1.1% |
| 77 | 5 | Columbus, Ohio | $680 | 4.6% | 13.3% | $1,000 | 5.3% | 14.9% |
| 77 | 1 | Lincoln, NE | $680 | 1.5% | -11.7% | $790 | -2.5% | -15.1% |
| 77 | -2 | Winston Salem, NC | $680 | -1.4% | -15.0% | $690 | -1.4% | -9.2% |
| 81 | -3 | Knoxville, TN | $670 | 0.0% | -2.9% | $800 | 3.9% | 5.3% |
| 82 | 2 | Cleveland, OH | $660 | 4.8% | 15.8% | $730 | 4.3% | -2.7% |
| 83 | 3 | Augusta, GA | $650 | 4.8% | 1.6% | $760 | -5.0% | 11.8% |
| 84 | -1 | El Paso, TX | $640 | 0.0% | -5.9% | $750 | -2.6% | -7.4% |
| 84 | -4 | Spokane, WA | $640 | -3.0% | 8.5% | $840 | 1.2% | 9.1% |
| 86 | 2 | Greensboro, NC | $630 | 5.0% | -4.5% | $810 | 5.2% | 12.5% |
| 86 | -2 | Tallahassee, FL | $630 | 0.0% | -3.1% | $800 | 2.6% | 6.7% |
| 86 | 2 | Tucson, AZ | $630 | 5.0% | 12.5% | $830 | 3.8% | 3.8% |
| 89 | 2 | Indianapolis, IN | $620 | 5.1% | 12.7% | $700 | 2.9% | 7.7% |
| 90 | 2 | Memphis, TN | $610 | 5.2% | -9.0% | $650 | 3.2% | -7.1% |
| 91 | -3 | Albuquerque, NM | $600 | 0.0% | 0.0% | $760 | 0.0% | -10.6% |
| 91 | -4 | Oklahoma City, OK | $600 | -1.6% | 0.0% | $770 | -1.3% | 0.0% |
| 93 | -1 | Lubbock, TX | $570 | -1.7% | 7.5% | $710 | 1.4% | -9.0% |
| 93 | -1 | Shreveport, LA | $570 | -1.7% | 1.8% | $650 | 1.6% | -5.8% |
| 93 | 2 | Tulsa, OK | $570 | 0.0% | -5.0% | $730 | 0.0% | -6.4% |
| 96 | 2 | Wichita, KS | $550 | 5.8% | 14.6% | $650 | -1.5% | 3.2% |
| 97 | 0 | Akron, OH | $530 | 0.0% | 3.9% | $660 | -1.5% | 1.5% |
| 97 | -1 | Detroit, MI | $530 | -1.9% | -1.9% | $620 | -4.6% | -4.6% |
| 99 | 0 | Fort Wayne, IN | $490 | 2.1% | 8.9% | $580 | 5.5% | 3.6% |
| 100 | 0 | Toledo, OH | $480 | 4.3% | 9.1% | $580 | 3.6% | -3.3% |
About
The Zumper Minneapolis Metro Report analyzed over 7,000 listings that hit the market in March 2017. Listings are aggregated by city to calculate median asking rents.
In the market for a new place? Search all Minneapolis apartments for rent on Zumper now.
Stay up to date with Zumper by following us on Facebook, Gazouillement, Instagram, & Pinterest.
Contenu associé


