The Zumper Miami Metro Report analyzed over 24,000 active listings in February across the 18 metro cities to show the most and least expensive cities and cities with the fastest growing rents.
Cities Ranked By Rent
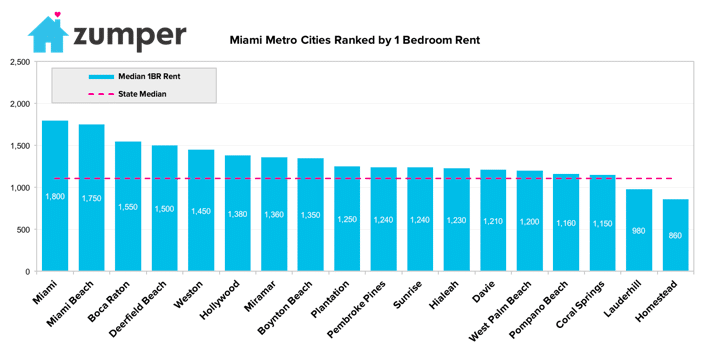
Most Expensive
– Miami, Floride was the most expensive city to rent in the metro area, with a one bedroom median of $1,800. The rent here was $700 more than the state median of $1,110.
– Miami Beach, FL ranked as the second priciest city with a median one bedroom rent of $1,750.
– Boca Raton, FL took the final spot in the top 3. One bedroom rent was priced at a median of $1,550.
Least Expensive
– Homestead, FL had the least expensive rent this month, with one bedroom units priced at a median of $860.
– Lauderhill, FL rents for this month was at a median $980, making it the second most affordable city in the area.
– Coral Springs, FL secured its spot as the third least expensive city, with one bedroom rent priced at a median of $1,150. Rent here was only $40 more expensive than the state median.
Yearly Growth Rate
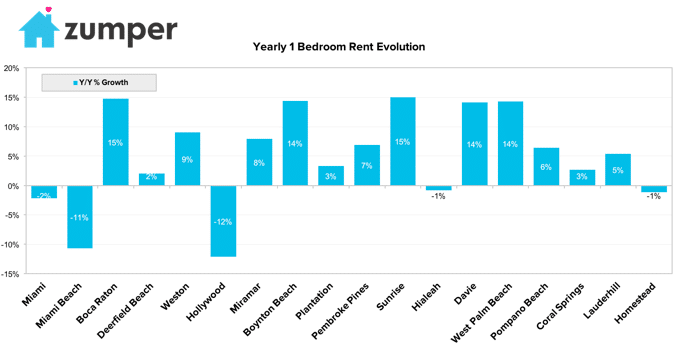
Fastest Growing
– Sunrise, FL had the fastest growing rents in the Miami metro area, as one bedroom prices were up 15% since this time last year.
– Boca Raton, FL was slightly behind Sunrise with a growth rate of 14.8%, making it the second city with the fastest growing rents.
– Boynton Beach ranked as the third city with the fastest growing rents. The price of one bedroom units here have risen 14.4% since last year.
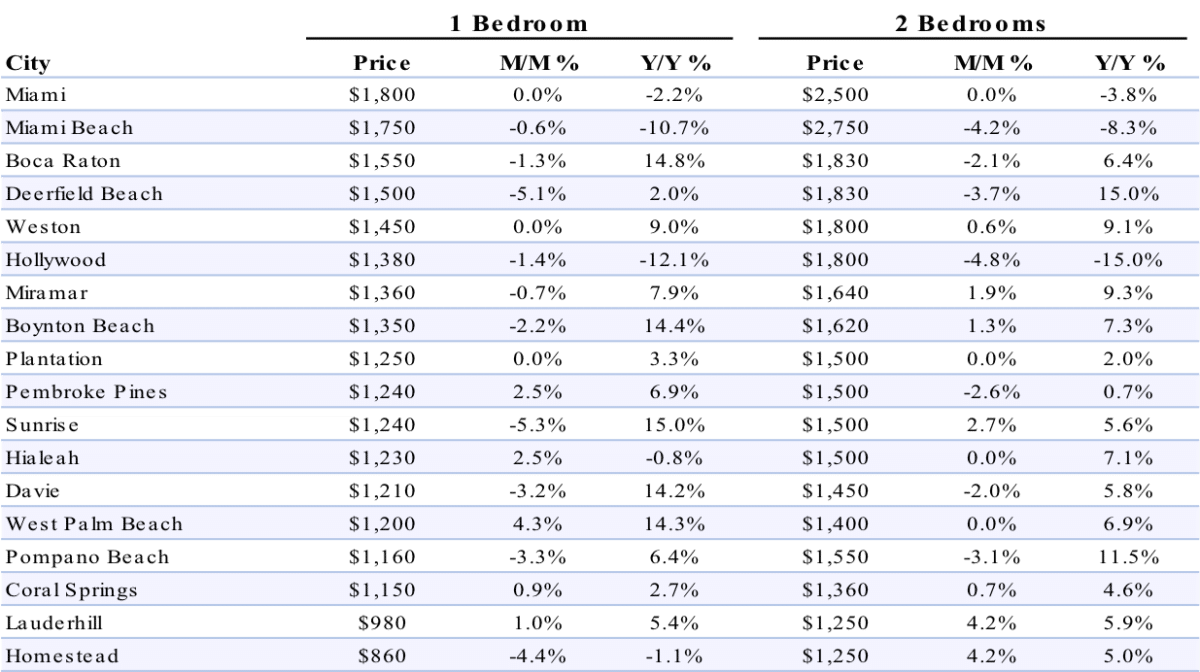
Full Data
| One Bedroom | Two Bedrooms | ||||||
|---|---|---|---|---|---|---|---|
| Pos. | City | Price | M/M % | Y/Y % | Price | M/M % | Y/Y % |
| 1 | Minneapolis | $1,350 | 0.00% | -1.50% | $1,640 | -5.20% | -3.00% |
| 2 | Minnetonka | $1,300 | 0.00% | 15.00% | $1,600 | 0.60% | 15.10% |
| 3 | Apple Valley | $1,290 | 4.90% | 15.20% | $1,310 | 4.00% | 9.20% |
| 4 | Edina | $1,250 | 0.80% | 13.60% | $1,500 | 4.90% | 11.10% |
| 5 | Eagan | $1,210 | 5.20% | 0.80% | $1,260 | 5.00% | 0.80% |
| 6 | Eden Prairie | $1,190 | -1.70% | -1.70% | $1,350 | -3.60% | -2.90% |
| 6 | Plymouth | $1,190 | 4.40% | 11.20% | $1,500 | 4.90% | 10.30% |
| 7 | Woodbury | $1,140 | -5.00% | -3.40% | $1,370 | 4.60% | 2.20% |
| 8 | Maple Grove | $1,020 | -4.70% | 14.60% | $1,300 | -3.00% | -1.50% |
| 9 | Burnsville | $960 | 0.00% | -2.00% | $1,220 | 5.20% | 4.30% |
| 10 | Bloomington | $930 | 4.50% | -14.70% | $1,220 | 3.40% | -5.40% |
| 11 | St Paul | $880 | 0.00% | -2.20% | $1,080 | -5.30% | 10.20% |
| 12 | Coon Rapids | $830 | -2.40% | -4.60% | $1,100 | 4.80% | -4.30% |
About
The Zumper Miami Metro Report analyzed over 24,000 listings that hit the market in February 2017. Listings are aggregated by city to calculate median asking rents.
In the market for a new place? Search all Miami apartments for rent on Zumper now.
Stay up to date with Zumper by following us on Facebook, Gazouillement, Instagram, & Pinterest.
Contenu associé


