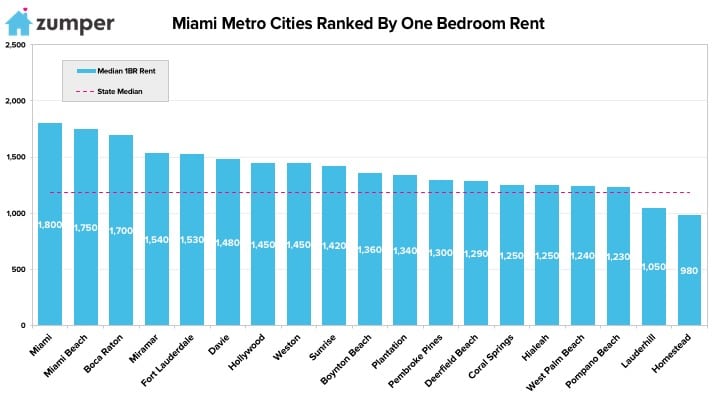
The Zumper Miami Metro Report analyzed active listings in June across 19 metro cities to show the most and least expensive cities and cities with the fastest growing rents. The Florida one bedroom state median was $1,185 last month.
Cities Ranked By Rent
Le plus cher
–Miami, Floride remained the most expensive city with one bedrooms priced at $1,800.
–Miami Beach, FL rent grew $50 to $1,750 but stayed the second priciest in the metro.
–Boca Raton, FL was third with rent at $1,700.
Le moins cher
–Homestead, FL saw rent drop $30 to $980 and continue to rank as the least expensive.
–Lauderhill, FL ranked as second most affordable with rent at $1,050.
–Pompano Beach, FL fell one spot, now behind West Palm Beach, to rank as third with rent dropping $20 to $1,230.
Growth Rate
La croissance la plus rapide (Y/Y%)
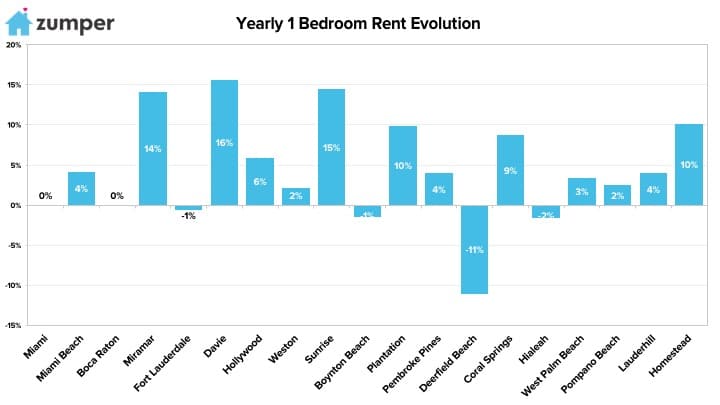
–Davie, FL, similar to last month, had the largest year over year rental growth rate in the metro, up 15.6%.
–Sunrise, FL saw rent climb 14.5%, making it the second fastest growing.
–Miramar, FL was third with rent rising 14.1%.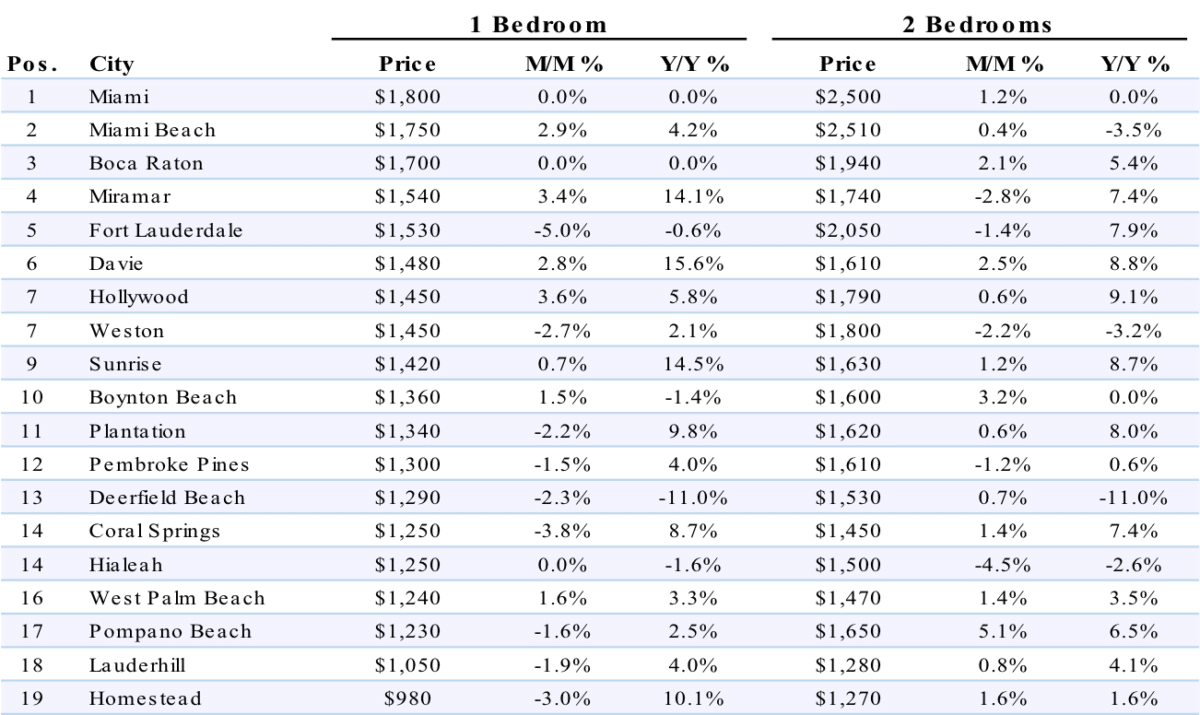
Full Data
| 1 Bedroom | 2 Bedrooms | ||||||
|---|---|---|---|---|---|---|---|
| Pos. | City | Price | M/M % | Y/Y % | Price | M/M % | Y/Y % |
| 1 | San Francisco, Californie | $3,500 | 0.00% | 2.30% | $4,730 | 1.10% | 5.10% |
| 2 | New York, NY | $2,900 | 1.40% | -1.40% | $3,290 | 2.20% | -0.30% |
| 3 | San Jose, CA | $2,550 | 2.80% | 7.10% | $3,010 | 0.00% | 6.70% |
| 4 | Boston, Massachusetts | $2,340 | 0.90% | 6.40% | $2,750 | 0.00% | 3.80% |
| 5 | Los Angeles, Californie | $2,330 | -1.30% | 8.40% | $3,210 | -3.00% | 3.50% |
| 6 | Washington, D.C. | $2,150 | -0.50% | -2.30% | $2,690 | -2.90% | -14.60% |
| 7 | Oakland, CA | $2,100 | 0.00% | -1.40% | $2,500 | 0.80% | -1.20% |
| 8 | Seattle, WA | $1,960 | -1.50% | 1.00% | $2,450 | -3.20% | -1.20% |
| 9 | San Diego, CA | $1,850 | 1.60% | 15.60% | $2,460 | 2.10% | 8.40% |
| 10 | Miami, Floride | $1,780 | -1.10% | -1.10% | $2,380 | -4.80% | -2.90% |
| 11 | Santa Ana, CA | $1,770 | 4.70% | 4.70% | $2,140 | 2.90% | 15.70% |
| 12 | Anaheim, CA | $1,680 | 3.70% | 8.40% | $2,120 | 1.00% | 10.40% |
| 13 | Honolulu, HI | $1,660 | -2.40% | -7.80% | $2,200 | 0.00% | 0.50% |
| 14 | Long Beach, CA | $1,600 | -0.60% | 15.10% | $2,020 | -3.30% | 8.00% |
| 15 | Chicago, Illinois | $1,510 | 0.70% | -5.00% | $1,850 | 2.20% | -13.60% |
| 16 | Denver, Colorado | $1,500 | 4.90% | 15.40% | $1,980 | -4.80% | 7.00% |
| 16 | Fort Lauderdale, FL | $1,500 | -2.00% | -3.80% | $1,970 | -3.90% | 3.70% |
| 16 | Philadelphie, Pennsylvanie | $1,500 | 0.00% | 7.10% | $1,700 | 0.00% | 6.30% |
| 19 | Portland, Oregon | $1,470 | 0.70% | 8.90% | $1,730 | -3.40% | 8.80% |
| 20 | Atlanta, Géorgie | $1,460 | 1.40% | 11.50% | $1,870 | 3.30% | 12.70% |
| 21 | Minneapolis, MN | $1,390 | -2.10% | 15.80% | $1,860 | 2.80% | 10.10% |
| 22 | Baltimore, MD | $1,380 | 3.80% | 3.00% | $1,670 | 3.70% | 15.20% |
| 23 | Nashville, TN | $1,370 | 3.00% | 15.10% | $1,450 | -1.40% | 2.80% |
| 23 | Providence, RI | $1,370 | -4.90% | 0.70% | $1,520 | 0.00% | 6.30% |
| 25 | New Orleans, LA | $1,340 | -4.30% | 6.30% | $1,530 | -3.80% | -4.40% |
| 26 | Dallas, Texas | $1,300 | -2.30% | 0.00% | $1,780 | 0.00% | -1.10% |
| 27 | Houston, Texas | $1,280 | 0.00% | 14.30% | $1,600 | -3.00% | 15.90% |
| 27 | Madison, WI | $1,280 | 0.00% | 8.50% | $1,420 | 0.70% | 15.40% |
| 29 | Scottsdale, AZ | $1,260 | 0.80% | 9.60% | $1,950 | 3.70% | -2.50% |
| 30 | Orlando, Floride | $1,250 | 0.80% | 15.70% | $1,440 | -2.00% | 15.20% |
| 31 | Sacramento, CA | $1,200 | -2.40% | 7.10% | $1,410 | -2.10% | 13.70% |
| 32 | Austin, Texas | $1,190 | 0.00% | 10.20% | $1,480 | 0.70% | 7.20% |
| 33 | Charlotte, Caroline du Nord | $1,180 | -4.80% | 3.50% | $1,290 | -5.10% | 4.90% |
| 33 | Plano, TX | $1,180 | 2.60% | 4.40% | $1,570 | 1.90% | 5.40% |
| 35 | Tampa, Floride | $1,160 | 0.00% | 8.40% | $1,380 | 0.00% | 9.50% |
| 36 | Aurora, CO | $1,140 | -0.90% | 14.00% | $1,460 | -0.70% | 5.00% |
| 36 | Irving, TX | $1,140 | -2.60% | -0.90% | $1,540 | -4.90% | 8.50% |
| 38 | Durham, NC | $1,130 | 0.90% | 15.30% | $1,310 | 1.60% | 15.90% |
| 39 | Newark, NJ | $1,120 | 0.90% | 14.30% | $1,390 | 0.00% | 15.80% |
| 40 | Fort Worth, TX | $1,100 | 4.80% | 15.80% | $1,310 | 3.10% | 14.90% |
| 41 | Pittsburgh, PA | $1,090 | -0.90% | -9.20% | $1,340 | -0.70% | -2.20% |
| 42 | Buffalo, NY | $1,080 | 1.90% | 14.90% | $1,400 | 5.30% | 7.70% |
| 42 | Gilbert, AZ | $1,080 | -0.90% | 3.80% | $1,340 | -1.50% | 0.00% |
| 44 | Henderson, NV | $1,060 | -0.90% | 11.60% | $1,240 | -0.80% | 13.80% |
| 45 | Chandler, AZ | $1,050 | 0.00% | 8.20% | $1,280 | 2.40% | 8.50% |
| 45 | Chesapeake, VA | $1,050 | 1.00% | 14.10% | $1,200 | 0.00% | 0.80% |
| 45 | Richmond, VA | $1,050 | -0.90% | 5.00% | $1,250 | -2.30% | 4.20% |
| 48 | Salt Lake City, UT | $1,040 | 0.00% | 15.60% | $1,350 | -2.20% | 14.40% |
| 48 | St Petersburg, FL | $1,040 | -2.80% | 15.60% | $1,500 | -2.60% | 7.90% |
| 50 | Virginia Beach, VA | $1,030 | 1.00% | 1.00% | $1,200 | 0.00% | 0.00% |
| 51 | Raleigh, NC | $1,000 | -1.00% | -2.90% | $1,190 | -0.80% | 2.60% |
| 52 | Phoenix, Arizona | $970 | -1.00% | 11.50% | $1,190 | -0.80% | 8.20% |
| 53 | Jacksonville, FL | $950 | 0.00% | 8.00% | $1,090 | -0.90% | 1.90% |
| 53 | Kansas City, MO | $950 | 0.00% | 13.10% | $1,100 | 0.00% | 10.00% |
| 55 | Boise, ID | $940 | 3.30% | 14.60% | $980 | 1.00% | 8.90% |
| 56 | Las Vegas, Nevada | $930 | 1.10% | 14.80% | $1,150 | 4.50% | 15.00% |
| 57 | Milwaukee, WI | $910 | -1.10% | 15.20% | $1,110 | -0.90% | 15.60% |
| 57 | San Antonio, TX | $910 | 1.10% | 9.60% | $1,160 | -0.90% | 11.50% |
| 59 | Anchorage, AK | $900 | 4.70% | 4.70% | $1,100 | 2.80% | -8.30% |
| 59 | Mesa, AZ | $900 | -1.10% | 11.10% | $1,030 | -4.60% | 8.40% |
| 61 | Colorado Springs, CO | $890 | -1.10% | 12.70% | $1,120 | 1.80% | 1.80% |
| 61 | Corpus Christi, TX | $890 | 3.50% | 2.30% | $1,070 | -1.80% | 7.00% |
| 61 | Fresno, CA | $890 | 0.00% | 7.20% | $1,130 | 4.60% | 13.00% |
| 64 | Syracuse, NY | $870 | -4.40% | 4.80% | $1,120 | 4.70% | 12.00% |
| 65 | Des Moines, IA | $860 | -1.10% | 3.60% | $930 | 2.20% | 2.20% |
| 65 | Louisville, KY | $860 | 1.20% | 6.20% | $980 | 2.10% | 15.30% |
| 67 | Omaha, NE | $850 | 0.00% | 9.00% | $1,100 | 3.80% | 15.80% |
| 68 | Reno, NV | $840 | 2.40% | 15.10% | $1,220 | 1.70% | 15.10% |
| 68 | Rochester, NY | $840 | 0.00% | 15.10% | $1,020 | 2.00% | 15.90% |
| 70 | Baton Rouge, LA | $830 | -4.60% | 3.80% | $910 | -3.20% | 0.00% |
| 70 | Knoxville, TN | $830 | 1.20% | 10.70% | $920 | -1.10% | 15.00% |
| 70 | Laredo, TX | $830 | -3.50% | 15.30% | $990 | 2.10% | 11.20% |
| 73 | Norfolk, VA | $820 | -1.20% | 13.90% | $1,000 | 0.00% | 11.10% |
| 74 | Arlington, TX | $810 | 3.80% | 15.70% | $1,080 | 2.90% | 14.90% |
| 74 | Cincinnati, OH | $810 | -1.20% | 15.70% | $1,110 | 4.70% | 14.40% |
| 76 | Cleveland, OH | $800 | 2.60% | 15.90% | $900 | 1.10% | 15.40% |
| 76 | St Louis, MO | $800 | -1.20% | 14.30% | $1,170 | 2.60% | 14.70% |
| 78 | Lexington, KY | $790 | -1.30% | -3.70% | $940 | -1.10% | 1.10% |
| 79 | Bakersfield, CA | $780 | 1.30% | 11.40% | $890 | -1.10% | -1.10% |
| 79 | Columbus, Ohio | $780 | 1.30% | 14.70% | $1,060 | -0.90% | 15.20% |
| 81 | Chattanooga, TN | $770 | 1.30% | 13.20% | $810 | 0.00% | 5.20% |
| 81 | Glendale, AZ | $770 | 2.70% | 13.20% | $1,030 | 3.00% | 14.40% |
| 83 | Spokane, WA | $760 | 4.10% | 11.80% | $940 | 4.40% | 14.60% |
| 83 | Winston Salem, NC | $760 | -2.60% | 15.20% | $840 | 2.40% | 15.10% |
| 85 | Memphis, TN | $740 | 1.40% | 13.80% | $780 | 1.30% | 14.70% |
| 86 | Greensboro, NC | $730 | -1.40% | 15.90% | $840 | 0.00% | 2.40% |
| 86 | Lincoln, NE | $730 | 4.30% | 9.00% | $960 | 3.20% | 15.70% |
| 86 | Tallahassee, FL | $730 | 0.00% | 15.90% | $850 | 0.00% | 10.40% |
| 89 | Augusta, GA | $720 | -4.00% | 14.30% | $830 | -2.40% | 6.40% |
| 90 | Oklahoma City, OK | $710 | 1.40% | 12.70% | $840 | 2.40% | 7.70% |
| 91 | Indianapolis, IN | $680 | -1.40% | 13.30% | $810 | -1.20% | 15.70% |
| 92 | Albuquerque, NM | $650 | -1.50% | 3.20% | $840 | -1.20% | 5.00% |
| 93 | Shreveport, LA | $640 | 0.00% | 14.30% | $740 | 0.00% | 13.80% |
| 94 | El Paso, TX | $630 | -1.60% | -3.10% | $760 | -1.30% | 1.30% |
| 94 | Tucson, AZ | $630 | 0.00% | -3.10% | $850 | 0.00% | 0.00% |
| 96 | Tulsa, OK | $610 | 0.00% | 1.70% | $770 | 0.00% | 2.70% |
| 96 | Wichita, KS | $610 | -1.60% | 15.10% | $750 | 0.00% | 15.40% |
| 98 | Detroit, MI | $600 | -1.60% | 13.20% | $690 | 1.50% | 15.00% |
| 98 | Lubbock, TX | $600 | 0.00% | 5.30% | $780 | -1.30% | 4.00% |
| 100 | Akron, OH | $570 | -5.00% | 7.50% | $750 | -1.30% | 15.40% |
À propos
The Zumper Miami Metro Report analyzed listings that hit the market last month. Listings are aggregated by city to calculate median asking rents.
In the market for a new place? Search all Miami apartments for rent on Zumper now.
Stay up to date with Zumper by following us on Facebook, Gazouillement, Instagram, & Pinterest.
Contenu associé


