The Zumper Miami Metro Report analyzed over 56,000 active listings in March across the 18 metro cities to show the most and least expensive cities and cities with the fastest growing rents.
Cities Ranked By Rent
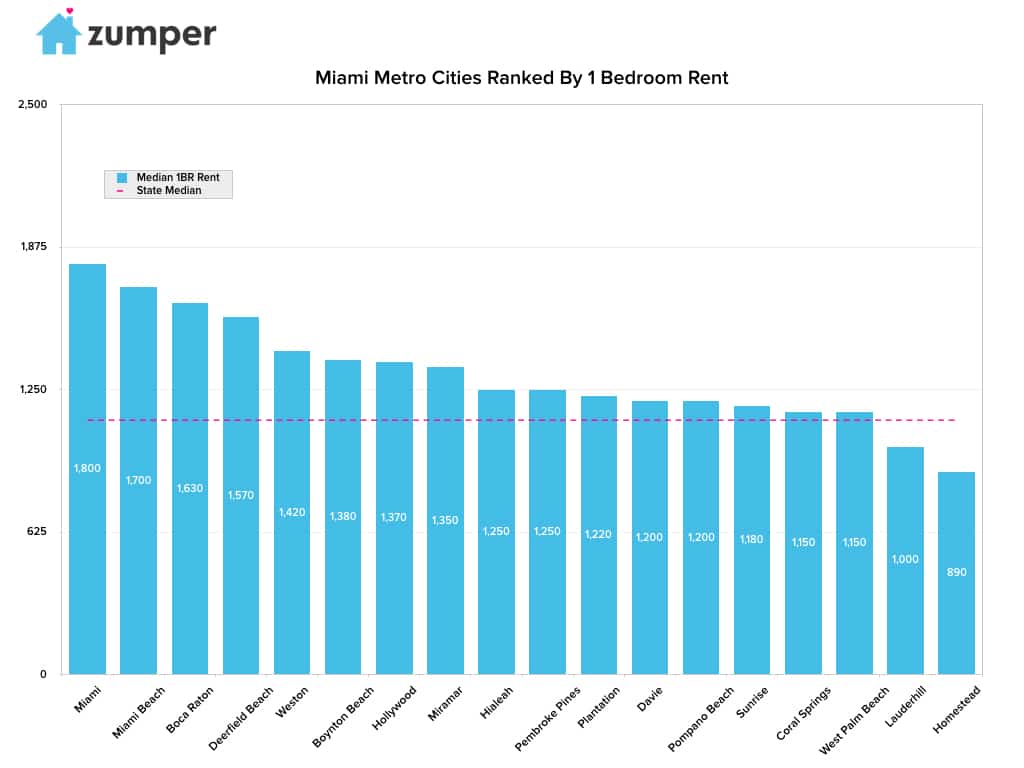
Le plus cher
–Miami, Floride continued to reign as the most expensive city in the metro area with one bedroom rent at $1,800 this month.
–Miami Beach, FL ranked as second with rent priced at $1,700.
–Boca Raton, FL followed behind as third with $1,630 rent.
Le moins cher
–Homestead, FL was the least expensive city to rent again, with one bedrooms priced at a median of $890.
–Lauderhill, FL ranked as the second most affordable at $1,000.
–West Palm Beach & Coral Springs, FL were tied for the third least expensive city with rents at $1,150.
Yearly Growth Rate
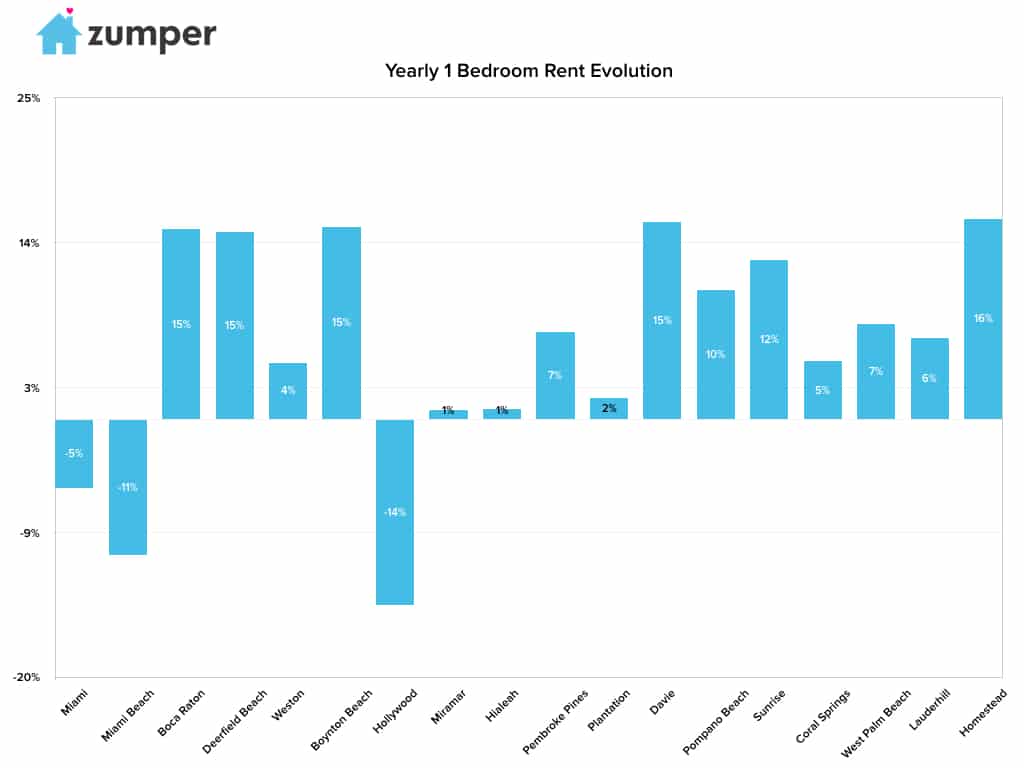
La croissance la plus rapide (Y/Y%)
–Homestead, FL had the fastest growing rents since this time last year, up 15.6%.
–Davie, FL followed closely behind with a yearly growth rate of 15.4%.
–Boynton Beach, FL rents, similar to last month, remained the third fastest growing, increasing 15% since this time last year.
La croissance la plus rapide (M/M%)
–Boca Raton, FL rent rose the fastest since last month, up 5.2%.
–Deerfield Beach, FL had the second fastest growing monthly rent, increasing 4.7%.
–Homestead, FL ranked as third with one bedroom rent growing 3.5% since last month.
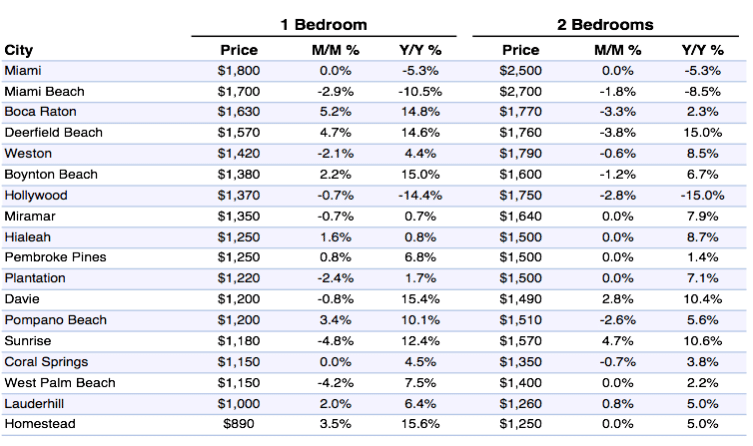
Full Data
| One Bedroom | Two Bedrooms | ||||||
|---|---|---|---|---|---|---|---|
| Pos. | City | Price | M/M % | Y/Y % | Price | M/M % | Y/Y % |
| 1 | Santa Monica | $3,000 | 3.10% | 0.70% | $3,870 | -0.30% | 1.60% |
| 2 | Pasadena | $2,140 | 0.50% | 7.00% | $2,550 | 0.00% | -1.90% |
| 3 | Los Angeles | $2,090 | 1.50% | 0.50% | $2,980 | 1.00% | 3.50% |
| 4 | Glendale | $2,000 | 2.60% | -6.10% | $2,670 | -1.50% | 7.20% |
| 5 | Culver City | $1,950 | -4.90% | 14.70% | $2,820 | -5.10% | 8.50% |
| 6 | Burbank | $1,760 | -2.20% | 11.40% | $2,420 | 0.40% | 15.20% |
| 7 | Santa Clarita | $1,740 | 1.80% | 5.50% | $2,010 | -1.50% | 2.60% |
| 8 | Alhambra | $1,600 | 5.30% | 15.10% | $1,960 | 4.80% | 15.30% |
| 8 | Torrance | $1,600 | 1.30% | 6.70% | $2,130 | 4.90% | 4.90% |
| 9 | West Covina | $1,520 | 4.80% | 15.20% | $1,740 | 0.00% | 7.40% |
| 10 | Lakewood | $1,450 | 1.40% | 15.10% | $2,090 | -5.00% | 14.80% |
| 11 | Downey | $1,370 | -2.10% | 14.20% | $1,890 | 1.10% | 15.20% |
| 12 | Hawthorne | $1,300 | 1.60% | 15.00% | $1,600 | 1.90% | 11.90% |
| 12 | Inglewood | $1,300 | 0.00% | 8.30% | $1,730 | -1.10% | 15.30% |
| 13 | Whittier | $1,290 | 2.40% | 15.20% | $1,700 | -2.90% | 6.30% |
| 14 | Bellflower | $1,240 | -1.60% | 12.70% | $1,660 | -2.90% | 15.30% |
| 14 | Pomona | $1,240 | 1.60% | 12.70% | $1,620 | -5.30% | 14.90% |
| 15 | Lancaster | $830 | -2.40% | -4.60% | $1,060 | -5.40% | 6.00% |
À propos
The Zumper Miami Metro Report analyzed over 56,000 listings that hit the market in March 2017. Listings are aggregated by city to calculate median asking rents.
In the market for a new place? Search all Miami apartments for rent on Zumper now.
Stay up to date with Zumper by following us on Facebook, Gazouillement, Instagram, & Pinterest.
Contenu associé


