Philadelphia started off the year as the 16th most expensive rental market in the nation, tied with Providence. The price of one bedrooms decreased a slight 0.7% to $1,400, while two bedrooms dropped 3.2% to $1,500. Similar to the monthly changes, year over year changes in the city were fairly flat as well, with one bedroom rent up 2.2% since this time last year and two bedrooms remaining unchanged. See which neighborhoods had the largest rent spikes and which took the biggest rent dips with this map.
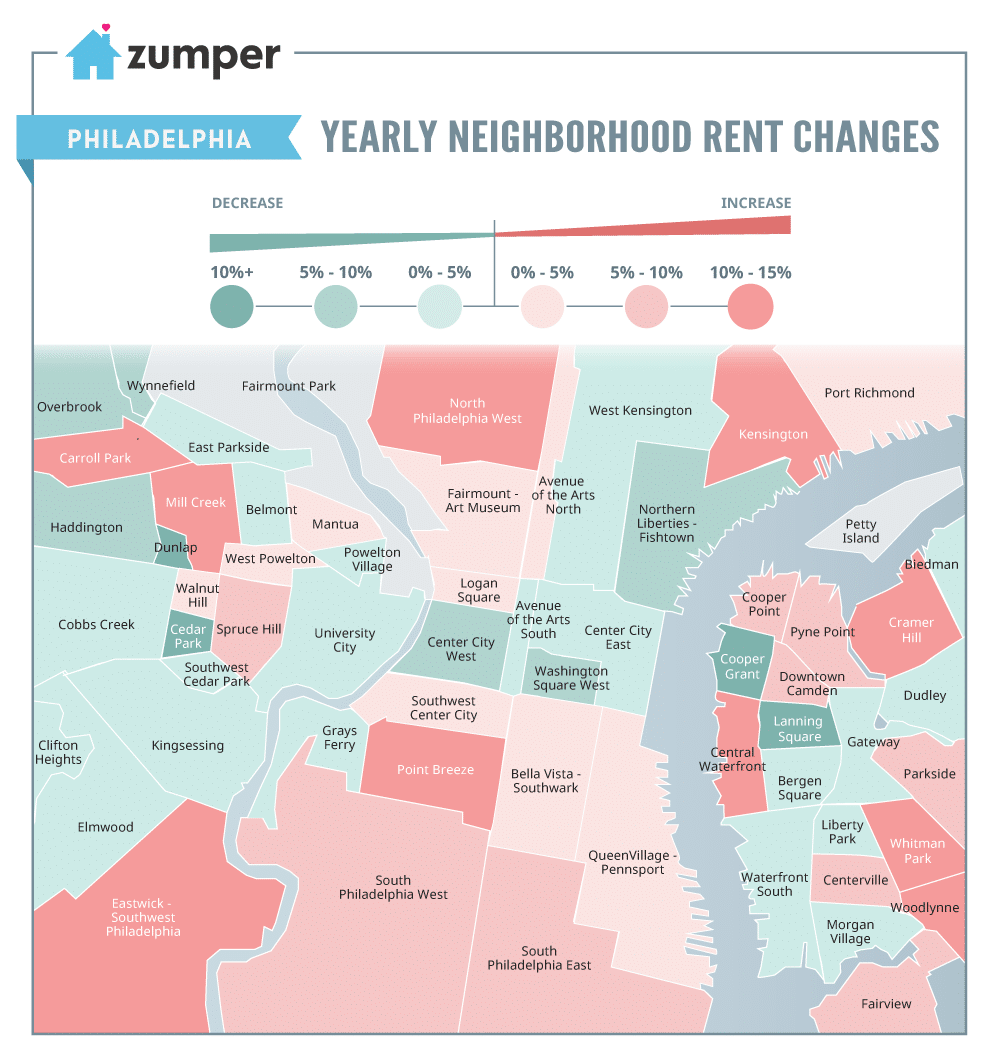
Overall, Philadelphia neighborhoods saw a mixture of upward and downward rental growth with a notable hot concentration in the upper and lower parts of the city. Central neighborhoods saw more of a cooling effect.
The Philadelphia neighborhoods with the fastest growing rents since this time last year were Point Breeze (+22%), Mill Creek (+21%), and Kensington (+17%). On the other end of the cost spectrum, the areas that saw the biggest rent dips were Cedar Park (-12%), Dunlap (-11%), and Haddington (-9%).
If you’re interested in how Philly rents compare with the rest of the nation’s, check out our February National Rent Report, which analyzes over 1 million active listings available in the prior month.
To keep up to date with rent changes across the country, like or follow us on Facebook, Gazouillement, ou Pinterest. In the market for a new place? Search Philadelphia apartments for rent on Zumper now.
Full Data
| 1 Bedroom | 2 Bedrooms | ||||||
|---|---|---|---|---|---|---|---|
| Pos. | City | Price | M/M % | Y/Y % | Price | M/M % | Y/Y % |
| 1 | Scottsdale | $1,360 | 1.50% | 13.30% | $2,120 | -1.90% | -7.80% |
| 2 | Gilbert | $1,130 | -0.90% | 14.10% | $1,350 | 0.70% | 6.30% |
| 3 | Chandler | $1,110 | 4.70% | 14.40% | $1,240 | 3.30% | 6.90% |
| 4 | Peoria | $1,100 | 2.80% | 15.80% | $1,310 | 0.80% | 14.90% |
| 5 | Tempe | $1,020 | 5.20% | 13.30% | $1,080 | -5.30% | -3.60% |
| 6 | Surprise | $1,010 | -1.90% | 13.50% | $1,670 | -5.10% | 8.40% |
| 7 | Goodyear | $1,000 | 1.00% | 11.10% | $1,260 | -2.30% | -13.10% |
| 8 | Phoenix | $960 | 3.20% | 14.30% | $1,100 | 0.00% | 7.80% |
| 9 | Avondale | $950 | 3.30% | 11.80% | $1,000 | 1.00% | 5.30% |
| 10 | Mesa | $910 | 4.60% | 13.80% | $960 | 2.10% | 1.10% |
| 11 | Glendale | $790 | 2.60% | 14.50% | $860 | 0.00% | -1.10% |
Contenu associé


