Miami started off the year as the 9th most expensive rental market in the nation. One bedroom rent grew 1.1% to $1,770, while two bedrooms increased 2.1% to $2,450. Though the city had a relatively stable year, with one and two bedrooms prices decreasing 1.7% and 2%, respectively, this map outlines which neighborhoods had the largest rent spikes and which took the biggest rent dips.
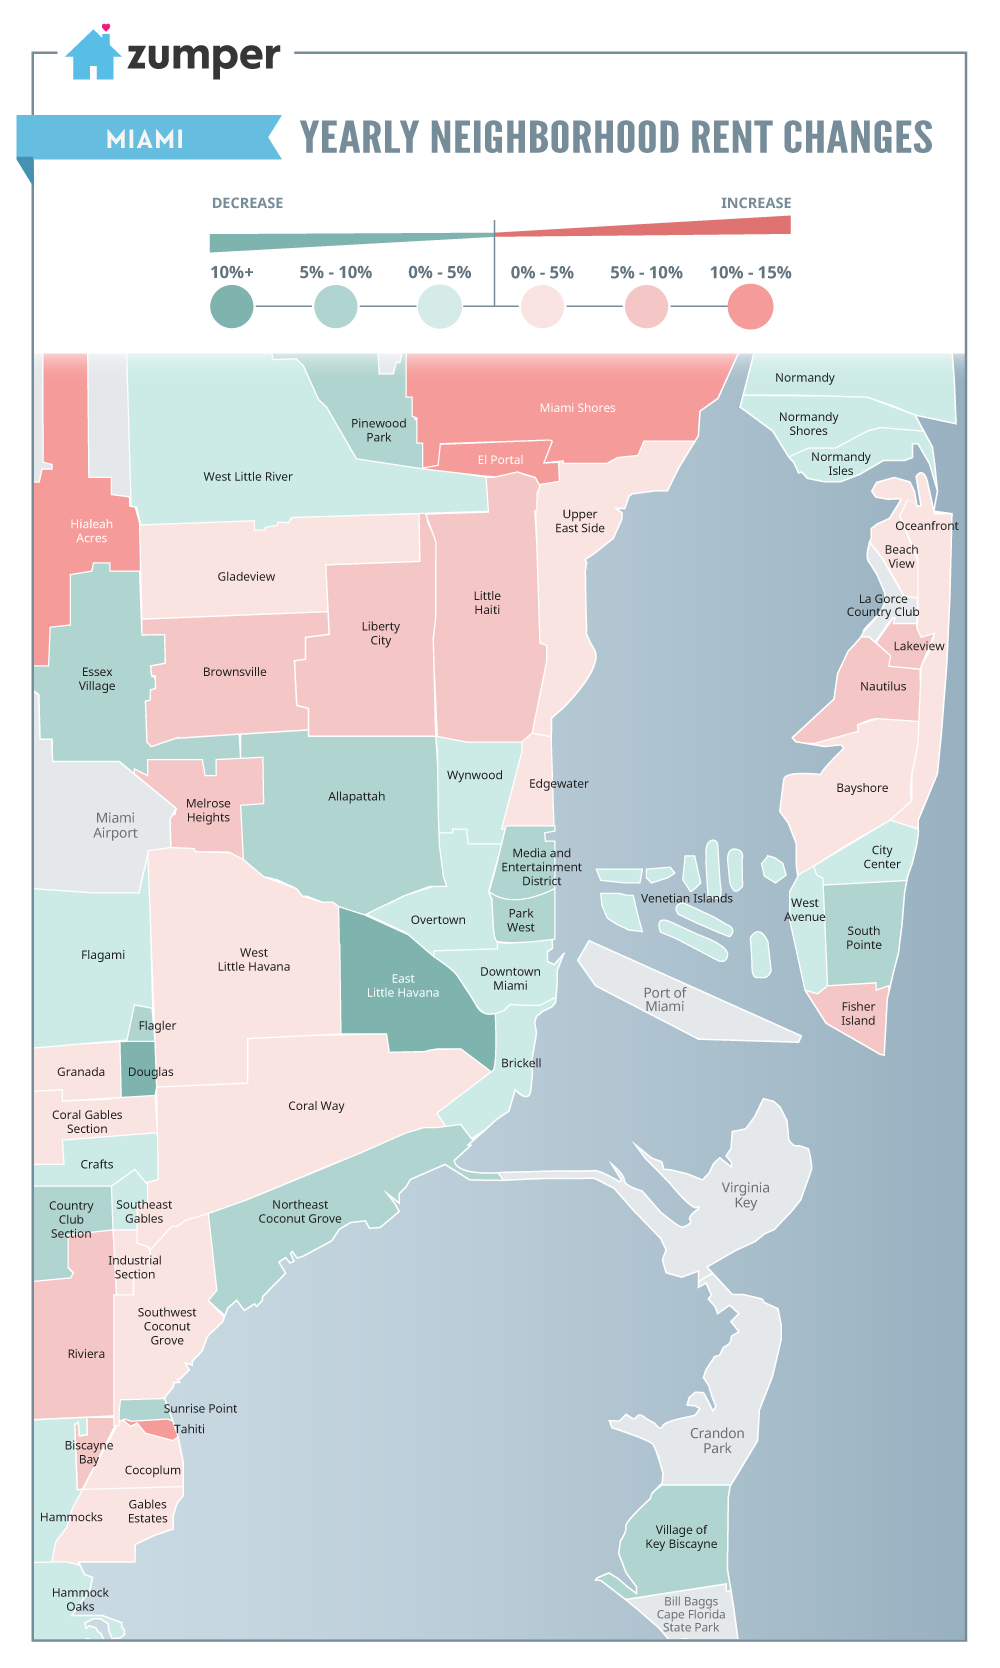
Overall, Miami neighborhoods saw a mixture of upward and rental growth throughout. Notably, there seems to be a hot concentration of growth around the Liberty City area.
Since this time last year, the areas with the fastest growing rents were Miami Shores (+25%), Hialeah Acres (+22%), and El Portal (+18%). On the other end of the spectrum, East Little Havana (-14%), Douglas (-11%), and Flagler (-10%) took the biggest rent dips.
If you’re interested in how Miami’s rents compare with the rest of the nation’s, check out Zumper’s February National Rent Report, which analyzes over 1 million active listings available in the prior month.
Restez informé(e) des actualités de Zumper en nous suivant sur Facebook, Gazouillement, ou Pinterest. Looking for a new place? Search all Miami apartments for rent on Zumper now.
Full Data
| Neighborhood | March 18 One Bed Rent | Y/Y% Change |
|---|---|---|
| View Park - Windsor hills | $1,600 | 25.49% |
| Congress Central | $1,375 | 19.57% |
| Voices of 90037 | $1,250 | 19.05% |
| CANNDU | $1,300 | 18.18% |
| Greater Cypress Park | $1,600 | 14.29% |
| Hollywood United | $2,050 | 13.89% |
| Congress West | $1,550 | 12.73% |
| Westlake | $1,630 | 12.41% |
| West Adams | $1,600 | 12.28% |
| Hollywood | $1,895 | 11.47% |
| West Los Angeles | $2,150 | 10.26% |
| Ladera Heights | $1,650 | 10.00% |
| UNNC | $1,540 | 10.00% |
| Hollywood Hills West | $2,200 | 10.00% |
| Congress Southwest | $1,200 | 9.09% |
| Westside | $2,280 | 8.57% |
| Florence-Graham | $1,300 | 8.33% |
| Marina del Rey | $2,900 | 7.41% |
| Historic Cultural | $2,400 | 6.67% |
| Brentwood | $2,450 | 6.52% |
| Mid-City West | $2,450 | 6.52% |
| Olympic Park | $1,700 | 6.25% |
| Macarthur Park | $1,480 | 5.71% |
| PICO | $1,950 | 5.41% |
| Silver Lake | $2,100 | 5.00% |
| Beverly Hills | $2,725 | 4.81% |
| Central Alameda | $1,050 | 3.96% |
| Park Mesa Heights | $1,295 | 3.60% |
| Glassell Park | $1,500 | 3.45% |
| Greater Griffith Park | $1,950 | 2.90% |
| Wilshire Center - Koreatown | $1,650 | 2.48% |
| Culver City | $2,100 | 2.44% |
| Westchester - Playa del Rey | $2,350 | 2.17% |
| Pacific Palisades | $2,700 | 1.89% |
| Greater Echo Park Elysian | $1,770 | 1.14% |
| Mar Vista | $1,900 | 0.26% |
| Bel Air/Beverly Crest | $2,300 | 0.00% |
| South Central LA | $1,100 | 0.00% |
| Congress North | $1,540 | -0.65% |
| Westwood | $2,600 | -0.95% |
| West Hollywood | $2,250 | -2.17% |
| Greater Wilshire | $1,940 | -2.51% |
| Venice | $2,800 | -3.11% |
| Santa Monica | $2,900 | -3.33% |
| Pico Union | $1,350 | -3.57% |
| South Robertson | $1,800 | -3.74% |
| Atwater Village | $1,700 | -5.03% |
| Mid City | $1,595 | -6.18% |
| Rampart Village | $1,550 | -7.46% |
| Downtown Los Angeles | $2,400 | -7.69% |
For a refresher on why and how we analyze our rental data, view our methodology blog post here.
Contenu associé


