The Zumper Los Angeles Metro Report analyzed active listings in March across 18 metro cities to show the most and least expensive cities and cities with the fastest growing rents. The California state median was $1,734 last month.
Cities Ranked By Rent
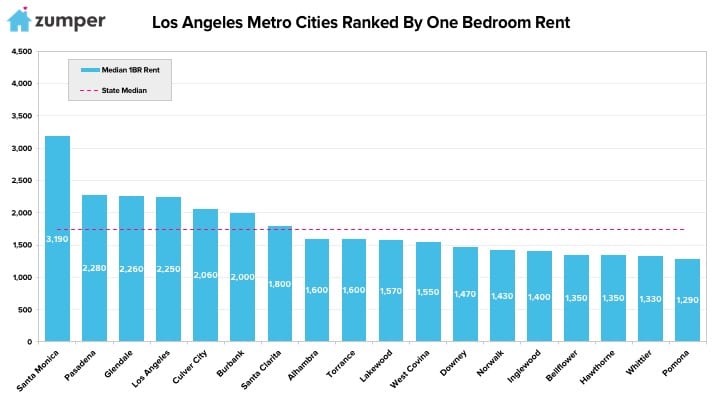
The Most Expensive
–Santa Monica, CA held on steady to its position as the most expensive rental market with one bedrooms priced at $3,190.
– Pasadena, CA moved up one spot, outpacing Los Angeles, to rank as the second priciest city with rent at $2,280.
–Glendale, CA also moved up a spot, and past Los Angeles as well, to become the third most expensive at $2,260.
The Least Expensive
–Pomona, CA rent fell down a spot to become the most affordable in the metro at $1,290.
–Whittier, CA dropped 2 spots to rank as the second least expensive city with rent at $1,330.
–Hawthorne & Bellflower, CA tied for third with one bedrooms priced at $1,350.
Growth Rate
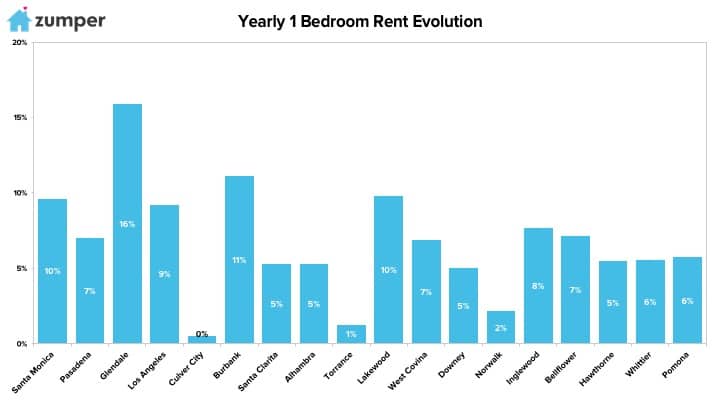
The Fastest Growing (Y/Y%)
–Glendale, CA had the fastest growing rent since this time last year, climbing 15.9%.
–Burbank, CA rent had the second largest year over year growth rate, up 11.1%.
–Lakewood, CA was third with rent increasing 9.8%.
The Fastest Growing (M/M%)
–Glendale & Norwalk, CA rent tied for the fastest growing last month, both up 5.1%.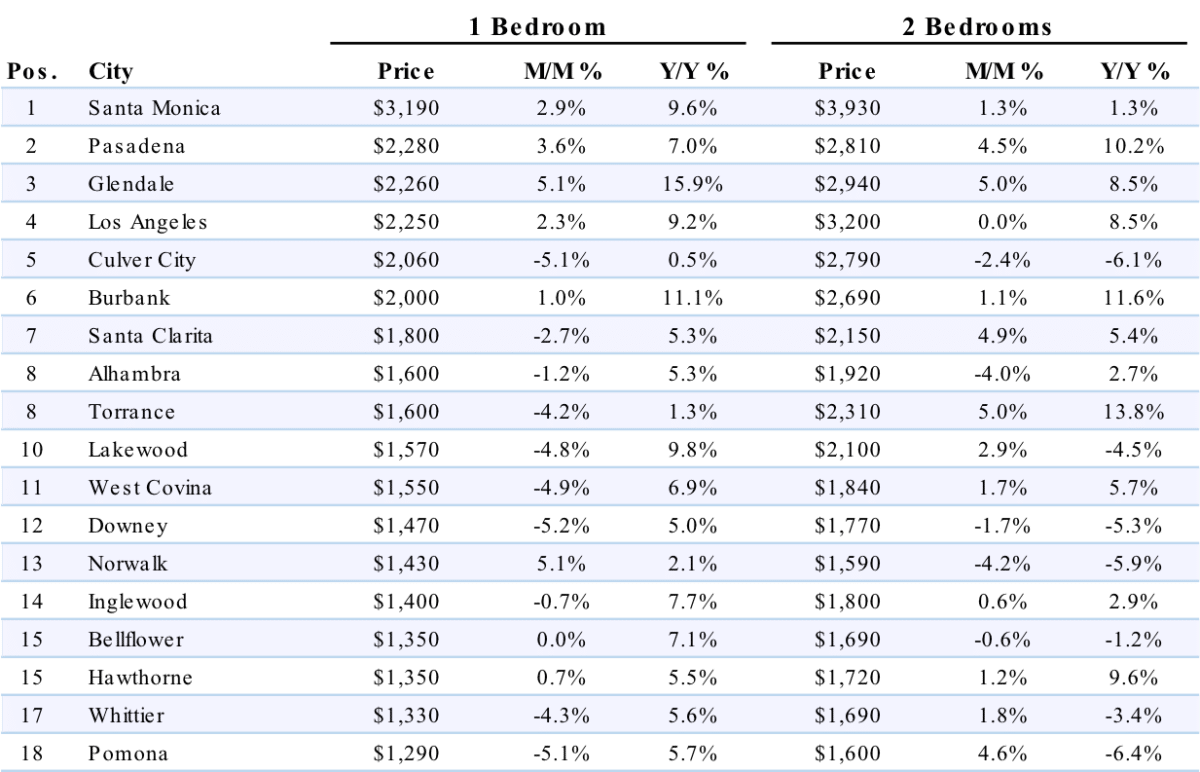
Full Data
| 1 Bedroom | 2 Bedrooms | ||||||
|---|---|---|---|---|---|---|---|
| Pos. | City | Price | M/M % | Y/Y % | Price | M/M % | Y/Y % |
| 1 | Sandy | $1,150 | 0.00% | 15.00% | $1,270 | 1.60% | 15.50% |
| 2 | Salt Lake City | $1,060 | 3.90% | 15.20% | $1,320 | 4.80% | 10.00% |
| 3 | South Jordan | $1,040 | 2.00% | 3.00% | $1,300 | 0.00% | -1.50% |
| 4 | Draper | $1,030 | 1.00% | 3.00% | $1,300 | -4.40% | 0.00% |
| 5 | Cottonwood Heights | $960 | -1.00% | 6.70% | $1,180 | 0.90% | 15.70% |
| 5 | Murray | $960 | 5.50% | 11.60% | $1,060 | 3.90% | 15.20% |
| 7 | West Jordan | $950 | 1.10% | 5.60% | $1,180 | 5.40% | 14.60% |
| 8 | Midvale | $940 | 2.20% | -6.90% | $1,100 | 0.00% | -7.60% |
| 9 | West Valley City | $900 | 0.00% | 12.50% | $1,070 | 3.90% | 10.30% |
| 10 | Millcreek | $860 | 0.00% | 11.70% | $1,030 | 4.00% | 12.00% |
| 11 | Taylorsville | $850 | -4.50% | 13.30% | $1,010 | 1.00% | 12.20% |
| 12 | South Salt Lake | $780 | 0.00% | 0.00% | $940 | 4.40% | 13.30% |
About
The Zumper LA Metro Report analyzed active listings that hit the market in March 2018. Listings are aggregated by city to calculate median asking rents.
In the market for a new place? Search all Los Angeles apartments for rent on Zumper now.
Stay up to date with Zumper by following us on Facebook, Gazouillement, Instagram, & Pinterest.
Contenu associé