The Zumper Los Angeles Metro Report analyzed active listings in April 2019 across 22 metro cities to show the most and least expensive cities and cities with the fastest growing rents. The California state median was $1,765 last month.
Cities Ranked By Rent
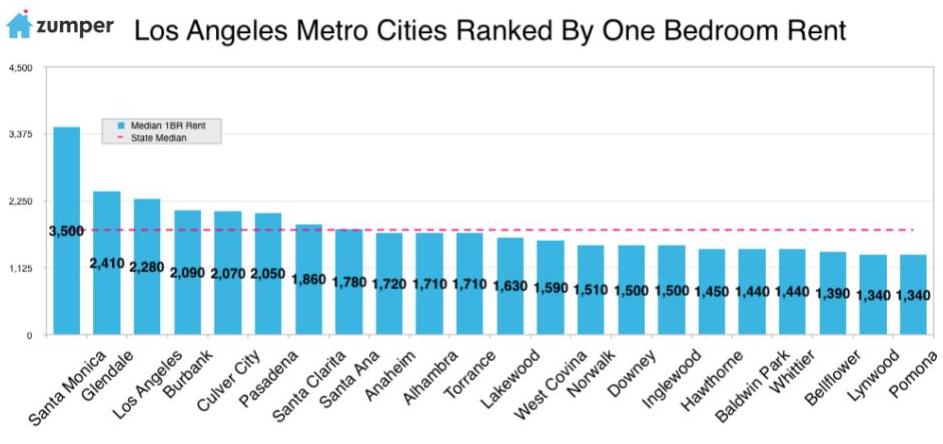
The Most Expensive
–Santa Monica, CA held steady as the priciest city in the LA metro area with rent at $3,500.
–Glendale, CA saw rent increase by $20 to $2,390 and continue to rank as the second most expensive city.
–Los Angeles, Californie was third with one bedrooms priced at $2,280.
The Least Expensive
–Pomona, CA saw a small dip and is now tied with Lynwood as the least expensive city with rent at $1,340.
Lynwood, CA saw rent climb slightly to $1,340 but remains the most affordable city, along with Pomona.
–Bellflower, CA moved up to third with one bedrooms priced at $1,390.
Growth Rate
The Fastest Growing (Y/Y%)
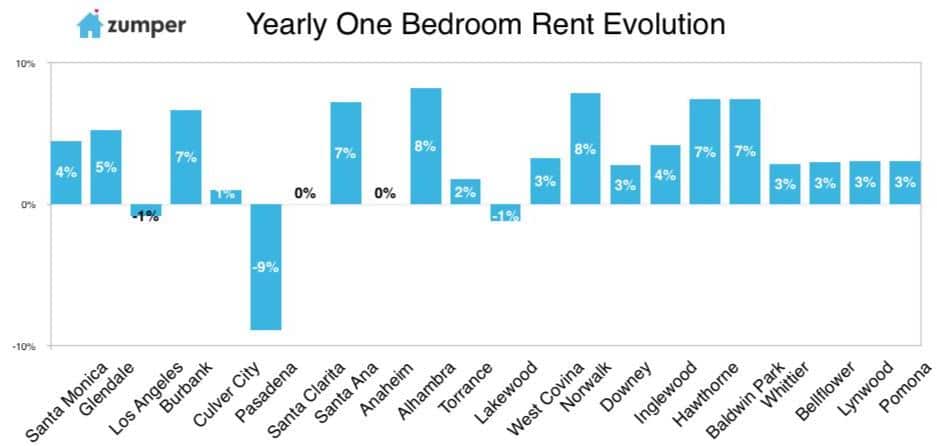
–Alhambra, CA had the fastest growing rent, up 8.2% since this time last year.
–Norwalk, CA rent jumped 7.9%, making it the second fastest growing.
–Baldwin Park, CA was third with rent climbing 7.5%.
The Fastest Growing (M/M%)
–Anaheim, CA had the largest monthly rental growth rate, up 4.9%.
–Whittier, CA followed with the second fastest growing rent of 2.1%.
–Downey, CA ranked third with rent growing 2% since last month.
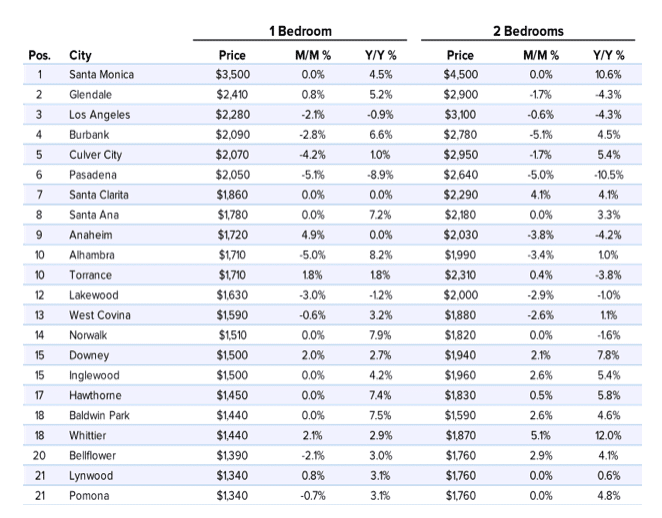
Full Data
| 1 Bedroom | 2 Bedrooms | ||||||
|---|---|---|---|---|---|---|---|
| Pos. | City | Price | M/M % | Y/Y % | Price | M/M % | Y/Y % |
| 1 | Santa Monica | $3,500 | 0.0% | 4.5% | $4,500 | 0.0% | 10.6% |
| 2 | Glendale | $2,410 | 0.8% | 5.2% | $2,900 | -1.7% | -4.3% |
| 3 | Los Angeles | $2,280 | -2.1% | -0.9% | $3,100 | -0.6% | -4.3% |
| 4 | Burbank | $2,090 | -2.8% | 6.6% | $2,780 | -5.1% | 4.5% |
| 5 | Culver City | $2,070 | -4.2% | 1.0% | $2,950 | -1.7% | 5.4% |
| 6 | Pasadena | $2,050 | -5.1% | -8.9% | $2,640 | -5.0% | -10.5% |
| 7 | Santa Clarita | $1,860 | 0.0% | 0.0% | $2,290 | 4.1% | 4.1% |
| 8 | Santa Ana | $1,780 | 0.0% | 7.2% | $2,180 | 0.0% | 3.3% |
| 9 | Anaheim | $1,720 | 4.9% | 0.0% | $2,030 | -3.8% | -4.2% |
| 10 | Alhambra | $1,710 | -5.0% | 8.2% | $1,990 | -3.4% | 1.0% |
| 10 | Torrance | $1,710 | 1.8% | 1.8% | $2,310 | 0.4% | -3.8% |
| 12 | Lakewood | $1,630 | -3.0% | -1.2% | $2,000 | -2.9% | -1.0% |
| 13 | West Covina | $1,590 | -0.6% | 3.2% | $1,880 | -2.6% | 1.1% |
| 14 | Norwalk | $1,510 | 0.0% | 7.9% | $1,820 | 0.0% | -1.6% |
| 15 | Downey | $1,500 | 2.0% | 2.7% | $1,940 | 2.1% | 7.8% |
| 15 | Inglewood | $1,500 | 0.0% | 4.2% | $1,960 | 2.6% | 5.4% |
| 17 | Hawthorne | $1,450 | 0.0% | 7.4% | $1,830 | 0.5% | 5.8% |
| 18 | Baldwin Park | $1,440 | 0.0% | 7.5% | $1,590 | 2.6% | 4.6% |
| 18 | Whittier | $1,440 | 2.1% | 2.9% | $1,870 | 5.1% | 12.0% |
| 20 | Bellflower | $1,390 | -2.1% | 3.0% | $1,760 | 2.9% | 4.1% |
| 21 | Lynwood | $1,340 | 0.8% | 3.1% | $1,760 | 0.0% | 0.6% |
| 21 | Pomona | $1,340 | -0.7% | 3.1% | $1,760 | 0.0% | 4.8% |
Contenu associé