The Zumper Los Angeles Metro Report analyzed over 29,000 active listings in April across 18 metro cities to show the most and least expensive cities and cities with the fastest growing rents.
Cities Ranked By Rent
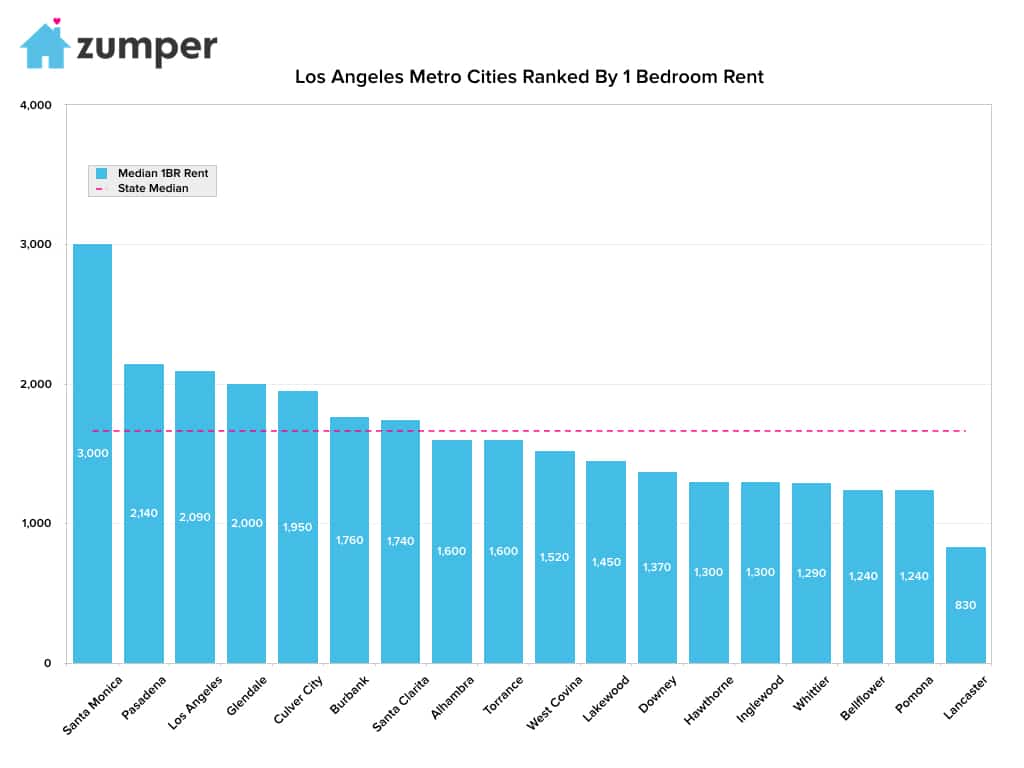
Most Expensive
–Santa Monica, CA continued to reign as the most expensive city to rent in the metro area. One bedroom units here were priced at a median of $3,000.
–Pasadena, CA, nearly $900 cheaper than Santa Monica, was the second priciest city with rent at $2,140.
–Los Angeles, Californie, close behind Pasadena, ranked as third with rent at $2,090.
Least Expensive
–Lancaster, CA was the most affordable city to rent this month with one bedroom units priced at a median of $830.
–Pomona & Bellflower, CA, were tied for the second least expensive city. Rent in these two cities was $1,240.
–Whittier, CA ranked as third with rent at $1,290.
Yearly Growth Rate
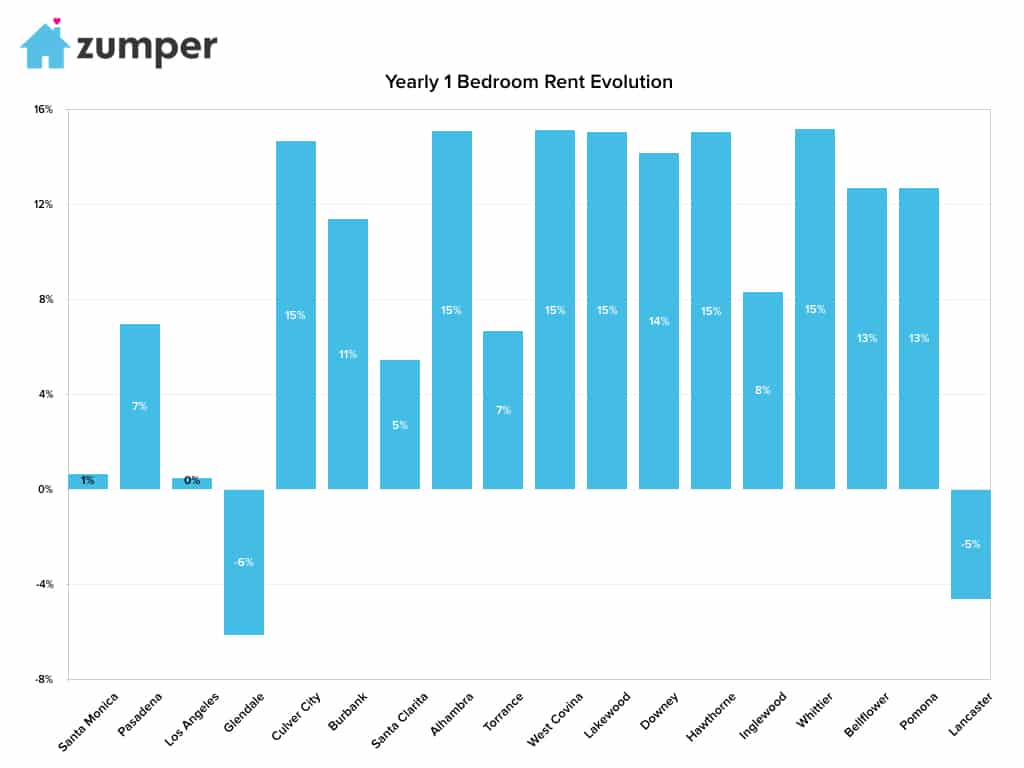
The Fastest Growing (Y/Y%)
–West Covina & Whittier, CA rents were tied for the fastest growing since this time last year, both up 15.2%.
–Lakewood & Alhambra, CA had the next fastest growing rents, both with a yearly growth rate of 15.1%.
–Hawthorne, CA ranked as third with rent up 15% since this time last year.
The Fastest Growing (M/M%)
–Alhambra, CA had the largest monthly growth rate, up 5.3%.
–West Covina, CA rent was the second fastest growing since this time last month, climbing 4.8%.
–Santa Monica, CA had the third largest monthly growth rate, climbing 3.1%.
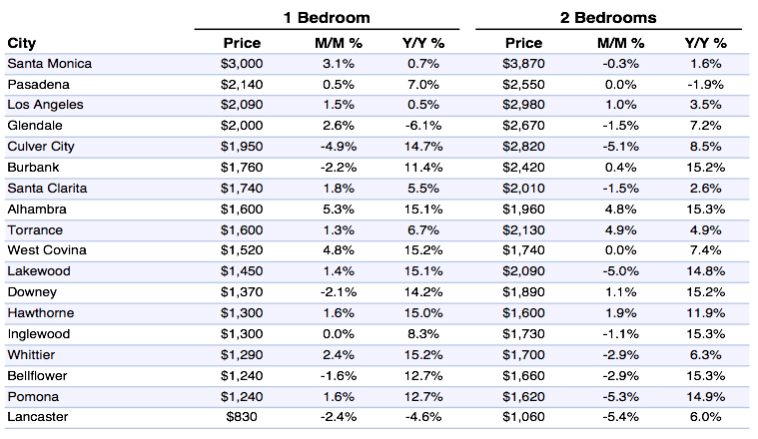
Full Data
| One Bedroom | Two Bedrooms | ||||||
|---|---|---|---|---|---|---|---|
| Pos. | City | Price | M/M % | Y/Y % | Price | M/M % | Y/Y % |
| 1 | Hillsboro | $1,370 | 3.00% | 6.20% | $1,500 | 0.00% | 0.70% |
| 2 | Portland | $1,340 | 0.00% | 0.00% | $1,590 | -0.60% | -1.90% |
| 3 | Gladstone | $1,250 | 0.00% | 14.70% | $1,380 | 0.00% | 15.00% |
| 3 | Lake Oswego | $1,250 | 4.20% | 8.70% | $1,470 | -2.00% | 4.30% |
| 4 | Happy Valley | $1,200 | 5.30% | 13.20% | $1,470 | 5.00% | 11.40% |
| 4 | Tualatin | $1,200 | 0.00% | 4.30% | $1,230 | 0.80% | 0.80% |
| 5 | Wilsonville | $1,180 | 0.00% | 1.70% | $1,440 | 1.40% | -2.00% |
| 6 | Fairview | $1,150 | -5.00% | 0.00% | $1,250 | -3.80% | -0.80% |
| 7 | Beaverton | $1,100 | 0.90% | 0.90% | $1,300 | 0.00% | 0.00% |
| 8 | Milwaukie | $1,030 | -1.90% | 14.40% | $1,300 | 1.60% | 9.20% |
| 9 | Gresham | $1,010 | 0.00% | 9.80% | $1,190 | 5.30% | 7.20% |
| 10 | Tigard | $990 | 4.20% | -2.90% | $1,100 | 0.00% | -8.30% |
| 11 | Oregon City | $960 | 5.50% | -15.00% | $1,210 | -3.20% | -2.40% |
About
The Zumper Los Angeles Metro Report analyzed over 29,000 listings that hit the market in April 2017. Listings are aggregated by city to calculate median asking rents.
In the market for a new place? Search all Los Angeles apartments for rent on Zumper now.
Stay up to date with Zumper by following us on Facebook, Gazouillement, Instagram, & Pinterest.
Contenu associé