The Zumper Los Angeles Metro Report analyzed active listings in June across 19 metro cities to show the most and least expensive cities and cities with the fastest growing rents.
Cities Ranked By Rent
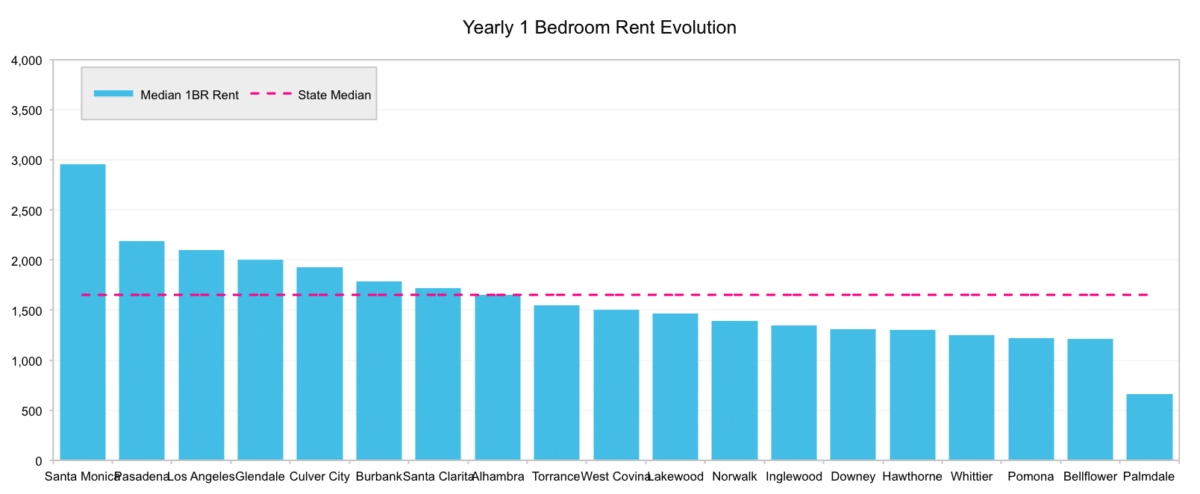
Most Expensive
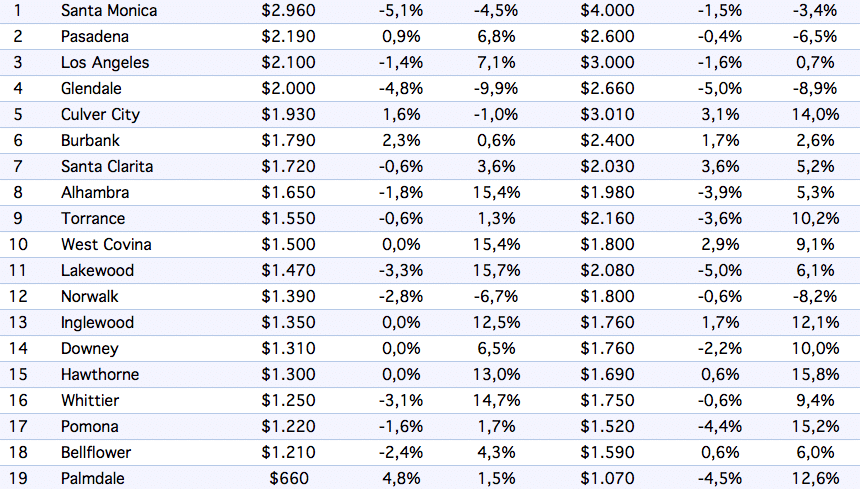
–Santa Monica, CA remained as the most expensive city to rent in the LA area. One bedroom units here were priced at a median of $2,960.
–Pasadena, CA ranked as the second priciest city with median rent at $2,190.
–Los Angeles, Californie followed Pasadena, ranking third with median rent for one bedroom units at $2,100.
Least Expensive
–Palmdale, CA ranked as the most affordable city with median one bedroom rent at $660.
–Bellflower, CA was the second least expensive city. The median rent for one bedroom units sits at $1,210.
–Pomona, CA ranked as third with median rent at $1,220.
Yearly Growth Rate
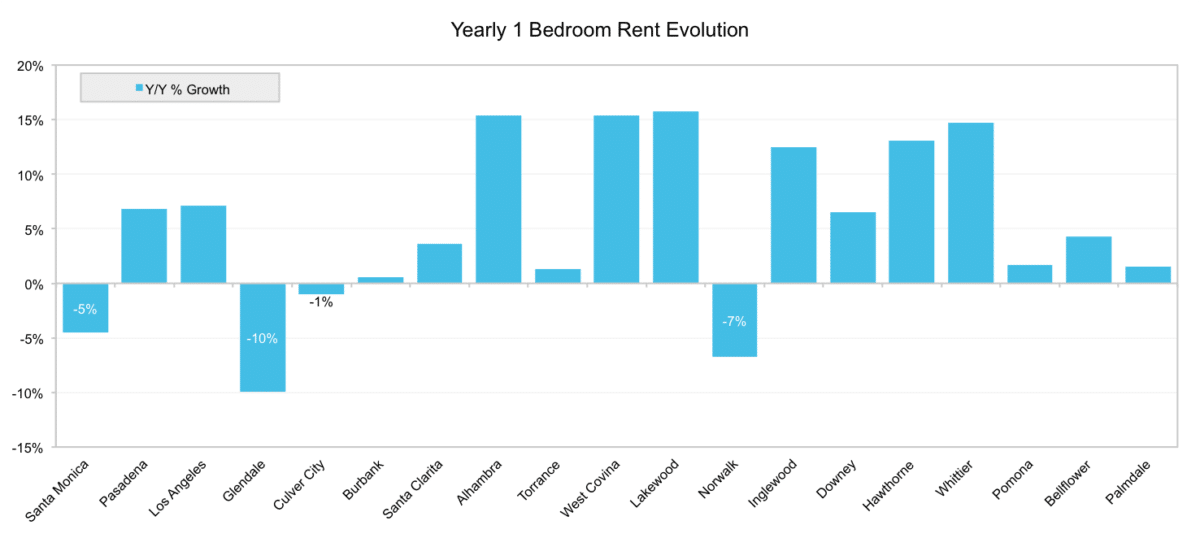
The Fastest Growing (Y/Y%)
–Lakewood, CA rent was the fastest growing, with a 15.7% yearly growth rate.
–West Covina & Alhambra, CA rents were tied for the second fastest growing since this time last year, both up 15.4%.
–Whittier, CA ranked as the third fastest growing, climbing 14.7% compared to last year.
The Fastest Growing (M/M%)
–Palmdale, CA had the largest monthly growth rate, up 4.8%.
–Burbank, CA had the second fastest growing rents, with a monthly growth rate of 2.3%.
–Culvar City, CA ranked as the third, seeing 1.6% increase in rents since this time last year.
Full Data
| Ranking | Metro Area | Retiree Population | Rent Score | Household Income | Housing Score (W/ Mortgage) | Housing Score (w/o Mortgage) | Safety Score | Healthcare Score | Weather Score | Overall Grade |
|---|---|---|---|---|---|---|---|---|---|---|
| 1 | Tucson, AZ | 95.6 | 43.9 | 18.1 | 39.15 | 47.8 | 93 | 74.1 | 90.05 | A |
| 2 | Redding, CA | 99.1 | 54.3 | 7.7 | 61.15 | 61.6 | 79.1 | 96.5 | 78.4 | A |
| 3 | Tampa-St. Petersburg-Clearwater, FL | 98.2 | 80.1 | 21.5 | 46.05 | 28.85 | 38.2 | 98.2 | 86.6 | A |
| 4 | Phoenix-Mesa-Scottsdale, AZ | 51.7 | 64.6 | 62 | 49.55 | 46.95 | 48.6 | 75 | 96.95 | A |
| 5 | Pensacola-Ferry Pass-Brent, FL | 68.9 | 18.9 | 35.3 | 23.2 | 9.45 | 59.1 | 58.6 | 68.5 | A- |
| 6 | Las Vegas-Henderson-Paradise, NV | 33.6 | 68.1 | 49.1 | 48.65 | 53 | 66.9 | 81 | 92.65 | A- |
| 7 | Little Rock-North Little Rock-Conway, AR | 43.9 | 10.3 | 31.8 | 23.65 | 21.5 | 89.5 | 88.7 | 77.95 | A- |
| 8 | Lake Charles, LA | 45.6 | 55.1 | 16.3 | 14.15 | 8.15 | 88.6 | 45.6 | 89.15 | A- |
| 9 | Beaumont-Port Arthur, TX | 54.3 | 23.2 | 15.5 | 28.85 | 11.15 | 54.7 | 95.6 | 63.3 | A- |
| 10 | Macon, GA | 63.7 | 7.7 | 1.7 | 13.7 | 4.25 | 74.7 | 90.5 | 74.95 | A- |
| 11 | Shreveport-Bossier City, LA | 62 | 18.1 | 5.1 | 25.8 | 6.4 | 84.3 | 87 | 76.65 | A- |
| 12 | Oklahoma City, OK | 27.5 | 21.5 | 48.2 | 25.8 | 30.1 | 63.4 | 93.1 | 75.35 | A- |
| 13 | Grand Junction, CO | 87.9 | 40.5 | 33.6 | 31.85 | 43.05 | 46 | 56 | 54.7 | A- |
| 14 | Midland, TX | 6.8 | 66.3 | 93.9 | 71.95 | 60.75 | 33.9 | 84.4 | 78.4 | A- |
| 15 | Amarillo, TX | 28.4 | 43.1 | 41.3 | 31.85 | 34.9 | 86 | 97.4 | 65.45 | A- |
| 16 | Corpus Christi, TX | 48.2 | 62 | 40.5 | 40.05 | 23.2 | 76.5 | 92.2 | 71.5 | A- |
| 17 | Evansville, IN-KY | 75 | 6.8 | 24.1 | 10.3 | 21.1 | 47.8 | 50.8 | 46.9 | A- |
| 18 | Pueblo, CO | 90.5 | 20.6 | 2.5 | 19.75 | 20.2 | 95.6 | 56.8 | 50.35 | A- |
| 19 | Chattanooga, TN-GA | 82.7 | 21.5 | 20.6 | 28.4 | 30.1 | 75.6 | 51.7 | 47.4 | B+ |
| 20 | Asheville, NC | 100 | 75 | 8.6 | 40.45 | 44.35 | 17.3 | 67.2 | 37 | B+ |
| 21 | Lynchburg, VA | 94.8 | 12.9 | 25.8 | 24.95 | 31.45 | 6 | 6 | 42.2 | B+ |
| 22 | Tulsa, OK | 53.4 | 24.1 | 38.7 | 25 | 20.2 | 67.8 | 65.5 | 62.45 | B+ |
| 23 | Knoxville, TN | 89.6 | 33.6 | 13.7 | 22.75 | 31 | 53.9 | 59.4 | 42.65 | B+ |
| 24 | Wichita, KS | 38.7 | 10.3 | 47.4 | 26.65 | 24.05 | 3.4 | 27.5 | 64.65 | B+ |
| 25 | Jacksonville, FL | 50 | 65.5 | 50 | 41.3 | 43.9 | 58.2 | 87.9 | 77.1 | B+ |
| 26 | Miami-Fort Lauderdale-West Palm Beach, FL | 93.9 | 95.6 | 28.4 | 74.95 | 74.95 | 29.5 | 100 | 92.2 | B+ |
| 27 | Wilmington, NC | 80.1 | 57.7 | 31 | 51.25 | 49.95 | 69.5 | 80.1 | 73.65 | B+ |
| 28 | Fort Smith, AR-OK | 71.5 | 3.4 | 0.8 | 1.25 | 4.25 | 72.1 | 18.1 | 63.35 | B+ |
| 29 | El Paso, TX | 9.4 | 27.5 | 3.4 | 37.85 | 28.4 | 13 | 34.4 | 83.55 | B+ |
| 30 | Harrisburg-Carlisle, PA | 81 | 35.3 | 71.5 | 56 | 61.15 | 60 | 41.3 | 40 | B+ |
| 31 | Topeka, KS | 83.6 | 8.6 | 46.5 | 31.45 | 37 | 80 | 3.4 | 51.7 | B+ |
| 32 | Davenport-Moline-Rock Island, IA-IL | 84.4 | 30.1 | 51.7 | 34.85 | 45.65 | 33 | 30.1 | 25.8 | B+ |
| 33 | Lubbock, TX | 13.7 | 25.8 | 14.6 | 35.3 | 20.25 | 93.9 | 91.3 | 71.5 | B+ |
| 34 | Montgomery, AL | 39.6 | 29.3 | 19.8 | 12.05 | 4.3 | 73 | 60.3 | 56.85 | B+ |
| 35 | Birmingham-Hoover, AL | 57.7 | 53.4 | 32.7 | 23.2 | 17.6 | 80.8 | 49.1 | 52.15 | B+ |
| 36 | Albuquerque, NM | 55.1 | 31 | 26.7 | 50.85 | 51.25 | 94.7 | 9.4 | 70.65 | B+ |
| 37 | Springfield, IL | 74.1 | 13.7 | 68.9 | 43.05 | 45.65 | 71.3 | 8.6 | 37 | B+ |
| 38 | Cheyenne, WY | 52.5 | 27.5 | 81.8 | 41.75 | 44.8 | 28.6 | 61.2 | 41.75 | B+ |
| 39 | Dayton, OH | 85.3 | 5.1 | 25 | 33.6 | 36.2 | 49.5 | 68.1 | 25.8 | B+ |
| 40 | Columbia, SC | 32.7 | 47.4 | 34.4 | 16.35 | 20.2 | 83.4 | 7.7 | 72.35 | B+ |
| 41 | Reno, NV | 56.8 | 73.2 | 56.8 | 66.35 | 65.9 | 40.8 | 76.7 | 59.9 | B+ |
| 42 | Jackson, MS | 25.8 | 45.6 | 12.9 | 25.4 | 12.85 | 42.6 | 68.9 | 69.8 | B+ |
| 43 | Peoria, IL | 81.8 | 31.8 | 66.3 | 45.65 | 52.55 | 21.7 | 10.3 | 30.15 | B+ |
| 44 | Brownsville-Harlingen, TX | 21.5 | 12 | 0 | 22.8 | 7.75 | 64.3 | 83.6 | 72.8 | B |
| 45 | Springfield, MO | 70.6 | 2.5 | 4.3 | 13.3 | 30.1 | 87.8 | 6.8 | 48.7 | B |
| 46 | Memphis, TN-MS-AR | 12.9 | 9.4 | 23.2 | 25.4 | 23.25 | 90.4 | 37 | 74.95 | B |
| 47 | Charleston-North Charleston, SC | 34.4 | 81.8 | 59.4 | 42.65 | 38.3 | 52.1 | 62 | 80.55 | B |
| 48 | Sioux City, IA-NE-SD | 62.9 | 19.8 | 43.9 | 24.5 | 31 | 37.3 | 23.2 | 36.6 | B |
| 49 | Kansas City, MO-KS | 35.3 | 37 | 72.4 | 49.55 | 51.2 | 61.7 | 26.7 | 52.1 | B |
| 50 | Greenville-Anderson-Mauldin, SC | 68.1 | 25 | 17.2 | 19.8 | 17.2 | 98.2 | 25.8 | 57.3 | B |
| 51 | Fort Wayne, IN | 42.2 | 2.5 | 37 | 6 | 18.9 | 23.4 | 13.7 | 34.85 | B |
| 52 | Greensboro-High Point, NC | 65.5 | 31.8 | 6.8 | 27.1 | 26.65 | 55.6 | 12.9 | 55.15 | B |
| 53 | Richmond, VA | 43.1 | 72.4 | 77.5 | 54.3 | 59.85 | 22.6 | 35.3 | 62.9 | B |
| 54 | San Antonio-New Braunfels, TX | 14.6 | 68.9 | 58.6 | 59.45 | 35.3 | 86.9 | 73.2 | 68.05 | B |
| 55 | Fresno, CA | 8.6 | 60.3 | 11.2 | 57.7 | 56.85 | 77.3 | 69.8 | 83.15 | B |
| 56 | Savannah, GA | 29.3 | 67.2 | 43.1 | 44.75 | 47.8 | 68.6 | 46.5 | 74.5 | B |
| 57 | Rapid City, SD | 72.4 | 34.4 | 45.6 | 58.55 | 53.4 | 43.4 | 36.2 | 37 | B |
| 58 | Virginia Beach-Norfolk-Newport News, VA-NC | 30.1 | 50.8 | 75.8 | 63.75 | 74.5 | 40 | 29.3 | 59.9 | B |
| 59 | Sacramento--Roseville--Arden-Arcade, CA | 44.8 | 82.7 | 79.3 | 84 | 79.7 | 39.1 | 12 | 76.25 | B |
| 60 | Pittsburgh, PA | 97.4 | 83.6 | 54.3 | 46.1 | 43.5 | 10.4 | 85.3 | 18.5 | B |
| 61 | Detroit-Warren-Dearborn, MI | 64.6 | 40.5 | 55.1 | 56.4 | 40.05 | 20.8 | 78.4 | 25.8 | B |
| 62 | Cleveland-Elyria, OH | 86.2 | 14.6 | 37.9 | 47.35 | 55.15 | 5.2 | 42.2 | 23.25 | B |
| 63 | Toledo, OH | 59.4 | 0.8 | 12 | 31.4 | 26.7 | 66 | 71.5 | 20.65 | B |
| 64 | Dallas-Fort Worth-Arlington, TX | 3.4 | 69.8 | 78.4 | 71.5 | 61.6 | 32.1 | 81.8 | 71.95 | B |
| 65 | Pocatello, ID | 23.2 | 0.8 | 6 | 20.25 | 43.9 | 34.7 | 89.6 | 38.3 | B |
| 66 | Bismarck, ND | 60.3 | 37.9 | 90.5 | 64.6 | 64.6 | 7.8 | 4.3 | 21.5 | B |
| 67 | New Orleans-Metairie, LA | 41.3 | 84.4 | 22.4 | 41.75 | 38.3 | 65.2 | 77.5 | 62.05 | B |
| 68 | Great Falls, MT | 93.1 | 43.9 | 10.3 | 43.5 | 38.3 | 70.4 | 16.3 | 31.45 | B- |
| 69 | Billings, MT | 79.3 | 25.8 | 52.5 | 53.85 | 60.7 | 81.7 | 21.5 | 29.7 | B- |
| 70 | Hartford-West Hartford-East Hartford, CT | 75.8 | 62 | 95.6 | 92.2 | 92.65 | 20 | 57.7 | 28.4 | B- |
| 71 | Indianapolis-Carmel-Anderson, IN | 20.6 | 15.5 | 56 | 26.25 | 28.85 | 73.9 | 15.5 | 34.45 | B- |
| 72 | Allentown-Bethlehem-Easton, PA-NJ | 87 | 81 | 75 | 77.55 | 79.7 | 4.3 | 86.2 | 22.75 | B- |
| 73 | Omaha-Council Bluffs, NE-IA | 17.2 | 50 | 73.2 | 56.4 | 62.9 | 36.5 | 31 | 34 | B- |
| 74 | Houston-The Woodlands-Sugar Land, TX | 2.5 | 85.3 | 76.7 | 69.8 | 57.25 | 2.6 | 72.4 | 67.2 | B- |
| 75 | Philadelphia-Camden-Wilmington, PA-NJ-DE-MD | 61.2 | 71.5 | 87 | 88.3 | 84.4 | 26 | 55.1 | 39.6 | B- |
| 76 | Baltimore-Columbia-Towson, MD | 49.1 | 90.5 | 97.4 | 84.45 | 87 | 51.3 | 70.6 | 39.2 | B- |
| 77 | Raleigh, NC | 5.1 | 70.6 | 88.7 | 60.3 | 60.7 | 60 | 38.7 | 49.5 | B- |
| 78 | Lincoln, NE | 19.8 | 38.7 | 50.8 | 54.7 | 69.35 | 53 | 47.4 | 41.35 | B- |
| 79 | Cincinnati, OH-KY-IN | 40.5 | 56 | 67.2 | 49.55 | 48.65 | 40.8 | 32.7 | 24.95 | B- |
| 80 | Des Moines-West Des Moines, IA | 15.5 | 61.2 | 83.6 | 63.3 | 59.9 | 26.9 | 14.6 | 29.25 | B- |
| 81 | Columbia, MO | 4.3 | 6 | 36.2 | 42.2 | 61.2 | 44.3 | 93.9 | 35.75 | B- |
| 82 | Binghamton, NY | 96.5 | 36.2 | 27.5 | 41.35 | 43.05 | 30.4 | 11.2 | 11.15 | B- |
| 83 | Atlanta-Sandy Springs-Roswell, GA | 6 | 89.6 | 70.6 | 48.65 | 44.35 | 60.8 | 62.9 | 62.45 | B- |
| 84 | Lansing-East Lansing, MI | 37.9 | 4.3 | 42.2 | 41.75 | 48.65 | 15.6 | 28.4 | 15.45 | B- |
| 85 | Green Bay, WI | 47.4 | 15.5 | 61.2 | 54.7 | 63.75 | 6.9 | 5.1 | 12.9 | B- |
| 86 | Buffalo-Cheektowaga-Niagara Falls, NY | 88.7 | 56.8 | 44.8 | 52.1 | 53.4 | 31.3 | 75.8 | 15.5 | B- |
| 87 | Spokane-Spokane Valley, WA | 69.8 | 39.6 | 30.1 | 56 | 61.15 | 91.3 | 22.4 | 17.2 | C+ |
| 88 | Atlantic City-Hammonton, NJ | 76.7 | 77.5 | 64.6 | 86.6 | 88.75 | 50.4 | 94.8 | 43.9 | C+ |
| 89 | Providence-Warwick, RI-MA | 77.5 | 87.9 | 69.8 | 85.3 | 90 | 13.9 | 52.5 | 35.7 | C+ |
| 90 | Duluth, MN-WI | 91.3 | 49.1 | 29.3 | 28.4 | 40.45 | 56.5 | 0 | 6.4 | C+ |
| 91 | Austin-Round Rock, TX | 0.8 | 78.4 | 89.6 | 88.3 | 89.15 | 35.6 | 43.1 | 68.5 | C+ |
| 92 | Salt Lake City, UT | 1.7 | 73.2 | 85.3 | 58.6 | 71.9 | 0.8 | 53.4 | 55.1 | C+ |
| 93 | Rochester, NY | 78.4 | 45.6 | 53.4 | 55.15 | 64.2 | 18.2 | 19.8 | 16.35 | C+ |
| 94 | Portland-South Portland, ME | 92.2 | 93.9 | 74.1 | 81 | 86.6 | 9.5 | 48.2 | 21.5 | C+ |
| 95 | Columbus, Ohio | 12 | 59.4 | 68.1 | 61.15 | 61.15 | 46.9 | 24.1 | 27.1 | C+ |
| 96 | Denver-Aurora-Lakewood, CO | 11.2 | 87 | 92.2 | 67.2 | 69.35 | 0 | 31.8 | 46.95 | C+ |
| 97 | Milwaukee-Waukesha-West Allis, WI | 46.5 | 50.8 | 63.7 | 75.4 | 81.85 | 57.3 | 37.9 | 21.5 | C+ |
| 98 | Grand Rapids-Wyoming, MI | 31 | 52.5 | 62.9 | 43.05 | 49.95 | 8.6 | 18.9 | 14.6 | C |
| 99 | Flagstaff, AZ | 7.7 | 86.2 | 39.6 | 54.25 | 24.5 | 45.2 | 54.3 | 47.8 | C |
| 100 | Minneapolis-St. Paul-Bloomington, MN-WI | 16.3 | 92.2 | 94.8 | 72.35 | 80.55 | 24.3 | 1.7 | 24.5 | C |
| 101 | Syracuse, NY | 67.2 | 63.7 | 60.3 | 50.35 | 56.85 | 16.5 | 44.8 | 11.15 | C |
| 102 | Missoula, MT | 36.2 | 48.2 | 18.9 | 75.8 | 74.95 | 62.6 | 82.7 | 13.75 | C |
| 103 | Kahului-Wailuku-Lahaina, HI | 66.3 | 98.2 | 93.1 | 55.15 | 55.55 | 78.2 | 39.6 | 90.05 | C |
| 104 | Fargo, ND-MN | 10.3 | 58.6 | 65.5 | 60.7 | 61.15 | 24.3 | 2.5 | 16.35 | C |
| 105 | Los Angeles-Long Beach-Anaheim, CA | 22.4 | 94.8 | 81 | 94.35 | 87.85 | 27.8 | 99.1 | 86.15 | C |
| 106 | Chicago-Naperville-Elgin, IL-IN-WI | 26.7 | 93.1 | 82.7 | 85.75 | 87.45 | 19.1 | 64.6 | 23.65 | C |
| 107 | Madison, WI | 24.1 | 76.7 | 84.4 | 85.7 | 87.45 | 12.1 | 0.8 | 15.05 | C- |
| 108 | Charlotte-Concord-Gastonia, NC-SC | 18.9 | 42.2 | 57.7 | 43.5 | 41.35 | 100 | 20.6 | 62.9 | C- |
| 109 | San Diego-Carlsbad, CA | 25 | 96.5 | 91.3 | 93.05 | 84.9 | 14.7 | 63.7 | 84 | C- |
| 110 | Portland-Vancouver-Hillsboro, OR-WA | 31.8 | 88.7 | 80.1 | 86.6 | 90.05 | 96.5 | 25 | 28 | C- |
| 111 | Burlington-South Burlington, VT | 37 | 91.3 | 87.9 | 92.6 | 93.95 | 11.3 | 43.9 | 8.6 | C- |
| 112 | Anchorage, AK | 0 | 75.8 | 99.1 | 86.55 | 86.6 | 92.1 | 79.3 | 0 | C- |
| 113 | San Francisco-Oakland-Hayward, CA | 50.8 | 100 | 100 | 99.55 | 93.95 | 82.6 | 50 | 72.35 | D+ |
| 114 | Seattle-Tacoma-Bellevue, WA | 18.1 | 97.4 | 96.5 | 89.15 | 93.9 | 84.3 | 17.2 | 26.65 | D+ |
| 115 | Abilene, TX | 58.6 | 17.2 | 9.4 | 26.7 | 9.45 | 1.7 | 66.3 | 80.1 | D+ |
| 116 | Boston-Cambridge-Newton, MA-NH | 56 | 99.1 | 98.2 | 96.5 | 97.35 | 99.1 | 33.6 | 38.75 | D+ |
| 117 | Albany-Schenectady-Troy, NY | 73.2 | 79.3 | 86.2 | 79.7 | 79.7 | 97.3 | 40.5 | 16.3 | D- |
About
The Zumper LA Metro Report analyzed active listings that hit the market in June 2017. Listings are aggregated by city to calculate median asking rents.
In the market for a new place? Search all Los Angeles apartments for rent on Zumper now.
Stay up to date with Zumper by following us on Facebook, Gazouillement, Instagram, & Pinterest.
Contenu associé