The Zumper Los Angeles Metro Report analyzed active listings in December 2018 across 22 metro cities to show the most and least expensive cities and cities with the fastest growing rents. The California state median was $1,780 last month.
Cities Ranked By Rent
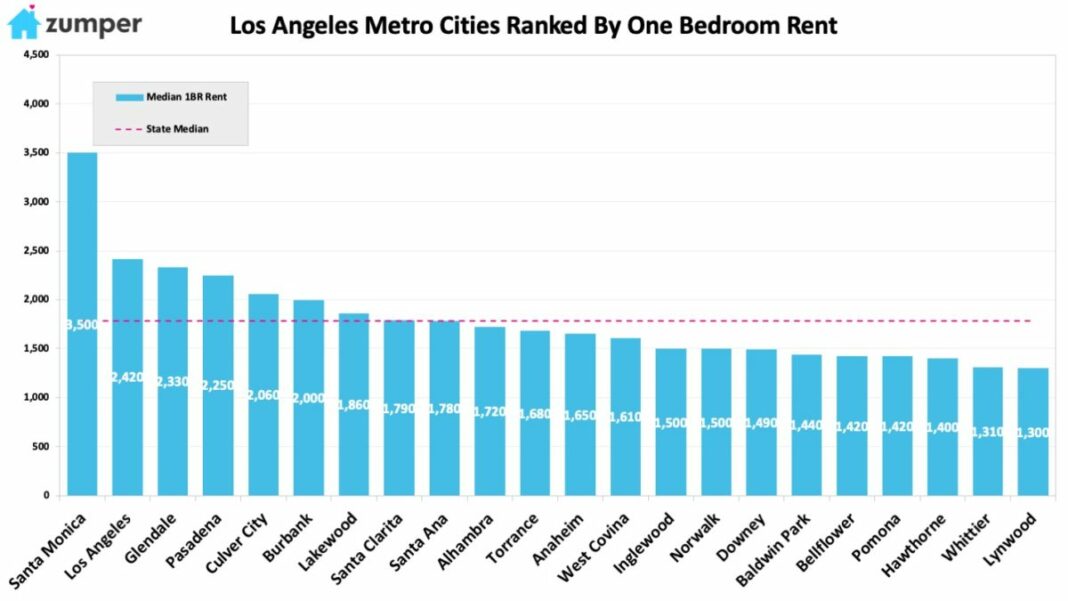 The Most Expensive
–Santa Monica, CA remained the priciest city with one bedrooms priced at $3,500.
–Los Angeles, Californie saw rent increase $10 to $2,420 but continue to rank as the second most expensive.
–Glendale, CA was third with rent at $2,330.
The Least Expensive
–Lynwood, CA rent grew $50 to $1,300 but stayed the most affordable in the metro.
–Whittier, CA dropped one spot to rank as the second least expensive city with rent falling $50 to $1,310.
–Hawthorne, CA fell 2 spots to become the 3rd most affordable with rent at $1,400.
Growth Rate
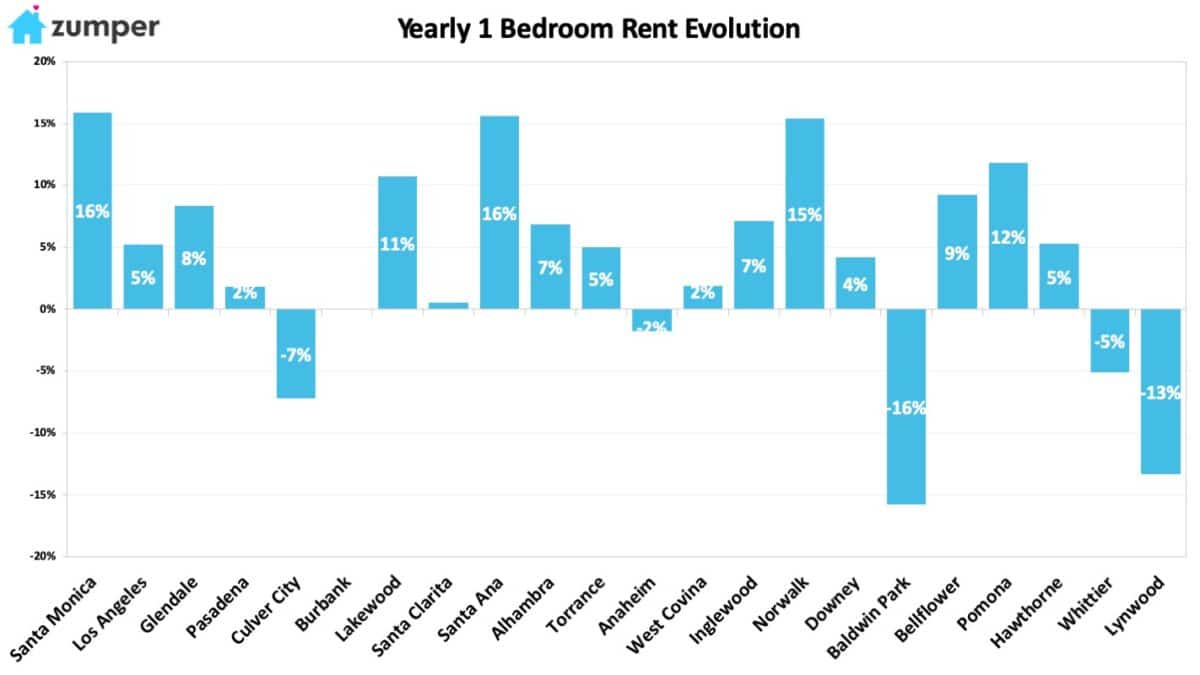
The Fastest Growing (Y/Y%)
–Santa Monica, CA had the fastest growing rent since this time last year, up 15.9%.
–Santa Ana, CA followed closely behind as second with rent climbing 15.6%.
–Norwalk, CA saw rent jump 15.4% since this time last year, making it third.
The Fastest Growing (M/M%)
–Baldwin Park CA rent had the largest monthly growth rate, up a whopping 5.9%.
–Pomona, CA was second with rent growing 5.2% last month.
–Lynwood, CA ranked as third with rent climbing 4%.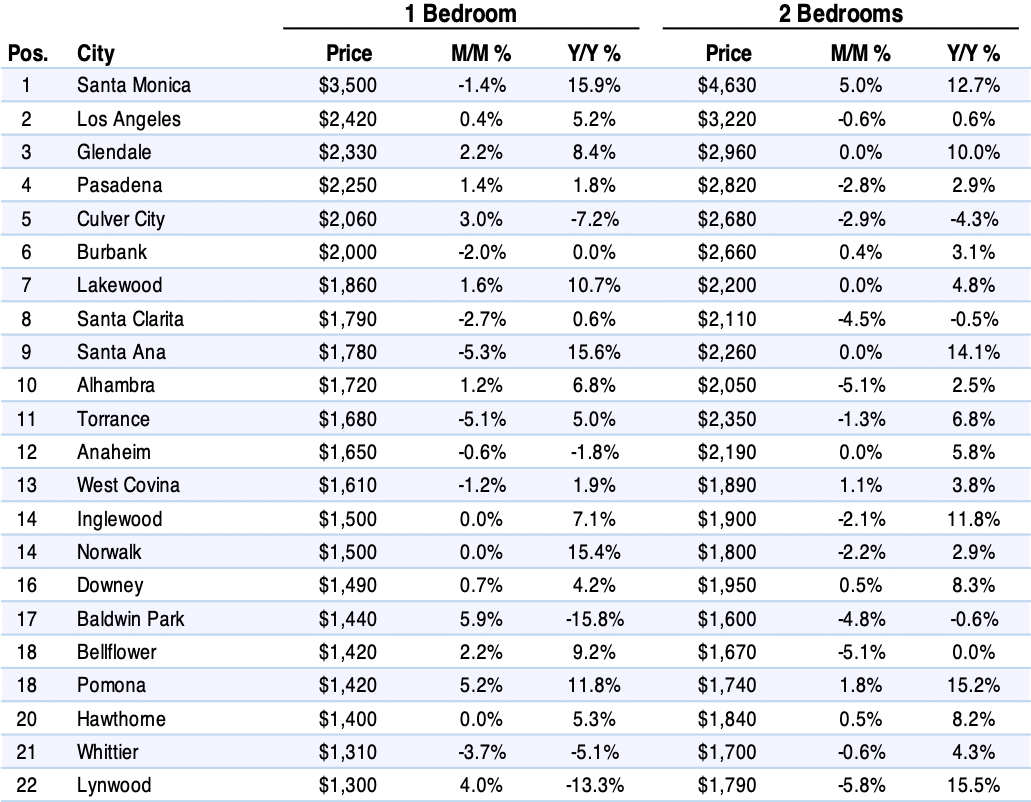
Full Data
| 1 Bedroom | 2 Bedrooms | ||||||
|---|---|---|---|---|---|---|---|
| Pos. | City | Price | M/M % | Y/Y % | Price | M/M % | Y/Y % |
| 1 | Santa Monica | $3,500 | -1.40% | 15.90% | $4,630 | 5.00% | 12.70% |
| 2 | Los Angeles | $2,420 | 0.40% | 5.20% | $3,220 | -0.60% | 0.60% |
| 3 | Glendale | $2,330 | 2.20% | 8.40% | $2,960 | 0.00% | 10.00% |
| 4 | Pasadena | $2,250 | 1.40% | 1.80% | $2,820 | -2.80% | 2.90% |
| 5 | Culver City | $2,060 | 3.00% | -7.20% | $2,680 | -2.90% | -4.30% |
| 6 | Burbank | $2,000 | -2.00% | 0.00% | $2,660 | 0.40% | 3.10% |
| 7 | Lakewood | $1,860 | 1.60% | 10.70% | $2,200 | 0.00% | 4.80% |
| 8 | Santa Clarita | $1,790 | -2.70% | 0.60% | $2,110 | -4.50% | -0.50% |
| 9 | Santa Ana | $1,780 | -5.30% | 15.60% | $2,260 | 0.00% | 14.10% |
| 10 | Alhambra | $1,720 | 1.20% | 6.80% | $2,050 | -5.10% | 2.50% |
| 11 | Torrance | $1,680 | -5.10% | 5.00% | $2,350 | -1.30% | 6.80% |
| 12 | Anaheim | $1,650 | -0.60% | -1.80% | $2,190 | 0.00% | 5.80% |
| 13 | West Covina | $1,610 | -1.20% | 1.90% | $1,890 | 1.10% | 3.80% |
| 14 | Inglewood | $1,500 | 0.00% | 7.10% | $1,900 | -2.10% | 11.80% |
| 14 | Norwalk | $1,500 | 0.00% | 15.40% | $1,800 | -2.20% | 2.90% |
| 16 | Downey | $1,490 | 0.70% | 4.20% | $1,950 | 0.50% | 8.30% |
| 17 | Baldwin Park | $1,440 | 5.90% | -15.80% | $1,600 | -4.80% | -0.60% |
| 18 | Bellflower | $1,420 | 2.20% | 9.20% | $1,670 | -5.10% | 0.00% |
| 18 | Pomona | $1,420 | 5.20% | 11.80% | $1,740 | 1.80% | 15.20% |
| 20 | Hawthorne | $1,400 | 0.00% | 5.30% | $1,840 | 0.50% | 8.20% |
| 21 | Whittier | $1,310 | -3.70% | -5.10% | $1,700 | -0.60% | 4.30% |
| 22 | Lynwood | $1,300 | 4.00% | -13.30% | $1,790 | -5.80% | 15.50% |
About
The Zumper LA Metro Report analyzed active listings that hit the market last month. Listings are aggregated by city to calculate median asking rents.
In the market for a new place? Search all Los Angeles apartments for rent on Zumper now.
Stay up to date with Zumper by following us on Facebook, Gazouillement, Instagram, & Pinterest.
Contenu associé