The Zumper Denver Metro Report analyzed active listings in April across 12 metro cities to show the most and least expensive cities and cities with the fastest growing rents. The Colorado state median rent was $1,227 last month.
Cities Ranked By Rent
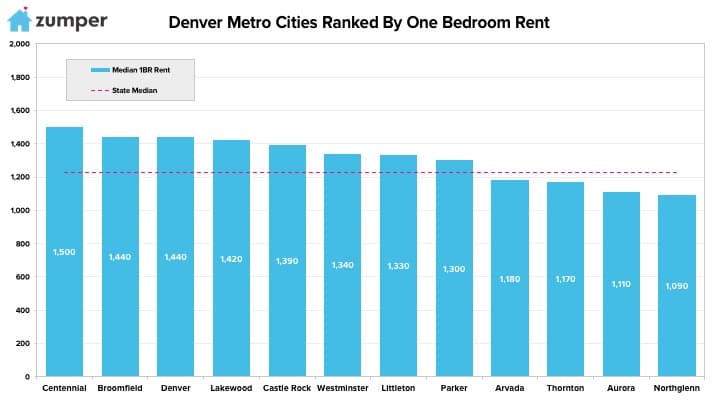
The Most Expensive
–Centennial, CO saw rent climb $10 to $1,500 and remain the most expensive in the metro.
–Broomfield & Denver, Colorado tied for second both with prices at $1,440.
–Lakewood, CO followed closely behind as third with rent at $1,420.
The Least Expensive
–Northglenn, CO rent dropped $60, settling at $1,090, and down one spot to become the most affordable in the metro.
–Aurora, CO moved up one spot to rank as the second least expensive city with one bedrooms priced at $1,110.
–Thornton, CO remained third with rent at $1,170.
Growth Rate
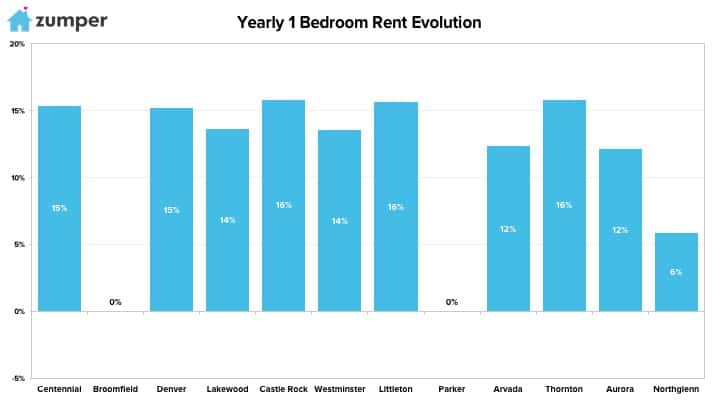
The Fastest Growing (Y/Y%)
–Castle Rock & Thornton, CO tied for the fastest growing city since this time last year, both with rents climbing 15.8%.
–Littleton, CO followed closely behind as second with rent jumping 15.7%.
–Centennial, CO had the third largest year over year rental growth rate, up 15.4%.
The Fastest Growing (M/M%)
–Arvada, CO rent was the fastest growing last month, rising 5.4%.
–Castle Rock, CO saw rent climb 5.3% last month, making it second.
–Lakewood, CO was the third fastest growing with rent up 5.2%.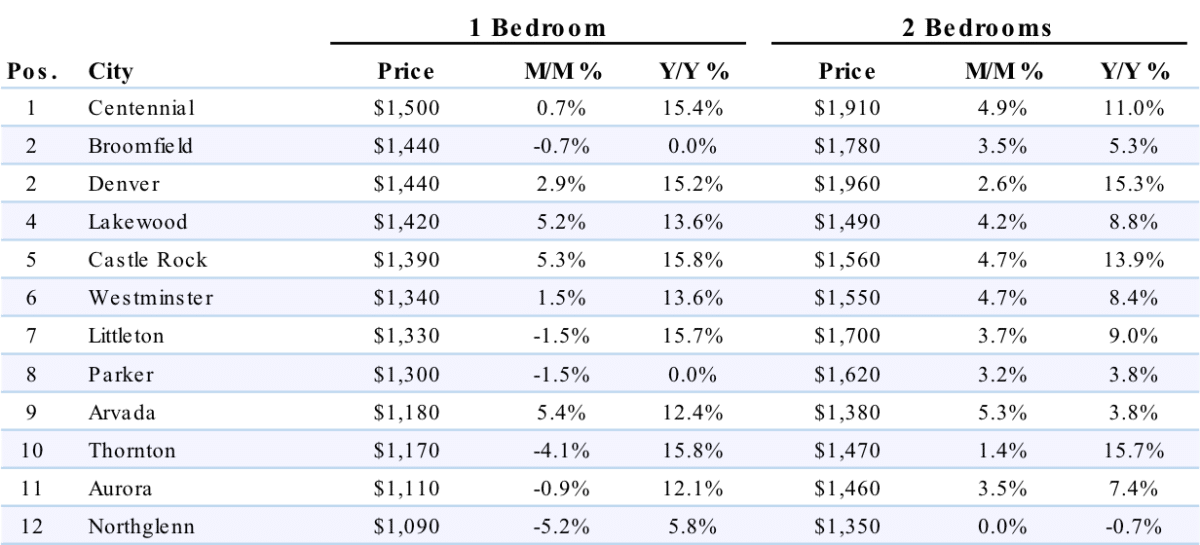
Full Data
| 1 Bedroom | 2 Bedrooms | ||||||
|---|---|---|---|---|---|---|---|
| 1 | Kirkland | $2,060 | 5.10% | 15.70% | $2,440 | 5.20% | 15.10% |
| 2 | Seattle | $1,990 | 1.50% | 3.60% | $2,520 | -0.80% | 2.40% |
| 3 | Bellevue | $1,930 | -3.00% | -2.00% | $2,350 | -1.30% | 0.00% |
| 4 | Redmond | $1,910 | 4.40% | 3.80% | $2,340 | 1.70% | 2.60% |
| 5 | Bothell | $1,560 | 0.00% | 0.60% | $1,800 | -3.20% | -3.20% |
| 6 | Sammamish | $1,500 | -2.00% | -15.30% | $1,870 | 1.10% | -6.00% |
| 7 | Lynnwood | $1,460 | 5.00% | 4.30% | $1,690 | 5.00% | 3.00% |
| 8 | Renton | $1,400 | -4.10% | 10.20% | $1,660 | -3.50% | 0.60% |
| 9 | Edmonds | $1,320 | 4.80% | -12.00% | $1,610 | -4.70% | 3.90% |
| 10 | Kent | $1,290 | 0.80% | 13.20% | $1,510 | 0.00% | 8.60% |
| 11 | Burien | $1,270 | -5.20% | 15.50% | $1,500 | 4.90% | 6.40% |
| 12 | Shoreline | $1,240 | -1.60% | -13.90% | $1,720 | 4.90% | 6.80% |
| 13 | Federal Way | $1,200 | 5.30% | 11.10% | $1,440 | 0.00% | 1.40% |
| 14 | Tacoma | $1,160 | 1.80% | 5.50% | $1,530 | 4.10% | 15.00% |
| 15 | Everett | $1,130 | 0.00% | 8.70% | $1,340 | -0.70% | 0.80% |
| 16 | Puyallup | $1,120 | -0.90% | 14.30% | $1,430 | 2.90% | 15.30% |
| 17 | Auburn | $1,000 | 0.00% | 11.10% | $1,340 | 0.80% | 13.60% |
| 18 | Lakewood | $950 | -4.00% | 13.10% | $1,240 | 0.80% | 3.30% |
| 19 | University Place | $940 | 3.30% | 8.00% | $1,180 | 0.90% | 11.30% |
| 20 | Marysville | $930 | 4.50% | 6.90% | $1,330 | 4.70% | 14.70% |
About
The Zumper Denver Metro Report analyzed active listings that hit the market last month. Listings are aggregated by city to calculate median asking rents.
In the market for a new place? Search all Denver apartments for rent on Zumper now.
Stay up to date with Zumper by following us on Facebook, Gazouillement, Instagram, & Pinterest.
Contenu associé