The Zumper Denver Metro Report analyzed over 10,000 active listings in April across 12 metro cities to show the most and least expensive cities and cities with the fastest growing rents.
Cities Ranked By Rent
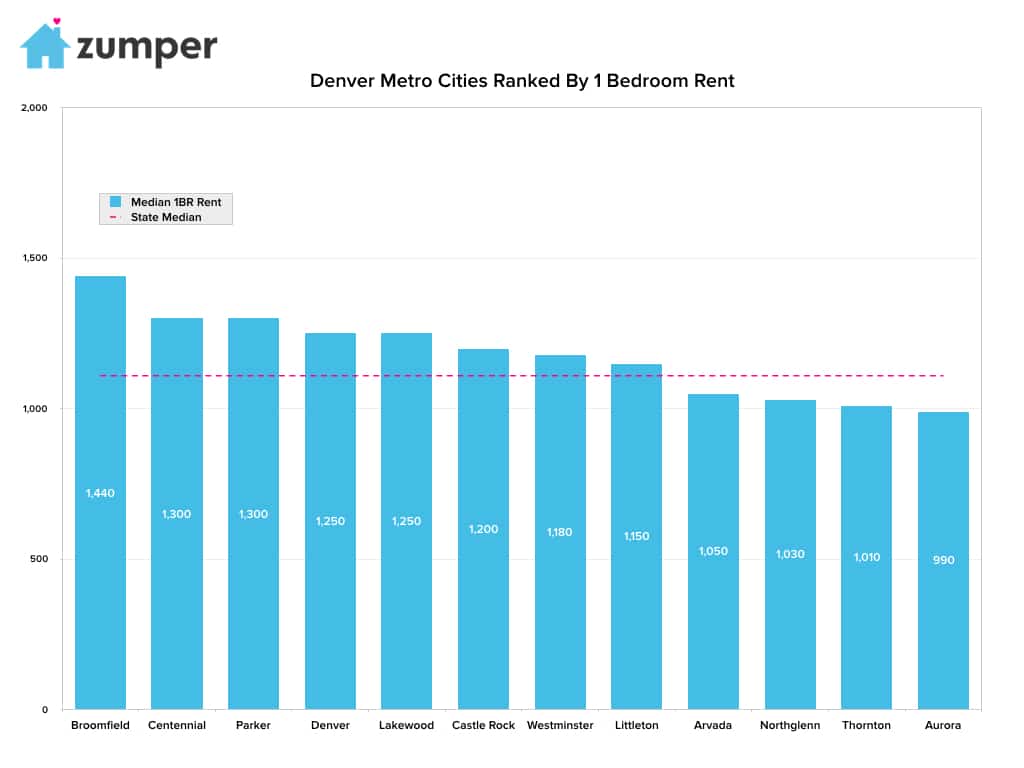
The Most Expensive
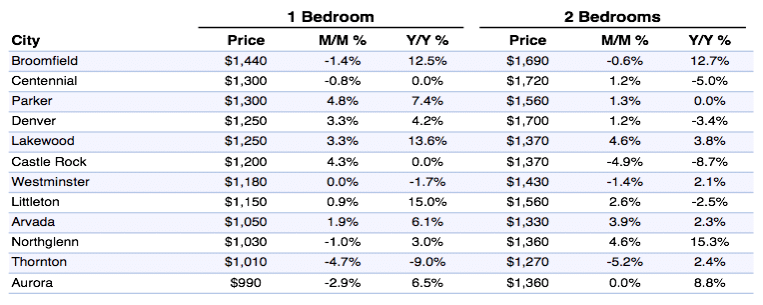
–Broomfield, CO continued to reign as the most expensive city to rent in the metro area. The price of one bedroom units here grew $50 since last month to median of $1,440.
–Centennial & Parker, CO were tied for the second priciest city to rent with one bedroom units at $1,300.
–Denver & Lakewood, CO rents were tied for the third most expensive at $1,250.
The Least Expensive
–Aurora, CO rent fell $30 this month to become the most affordable city.
–Thornton, CO one bedroom prices dropped to $1,010, making it the second least expensive.
–Northglenn, CO was third with rent at $1,030.
Yearly Growth Rate
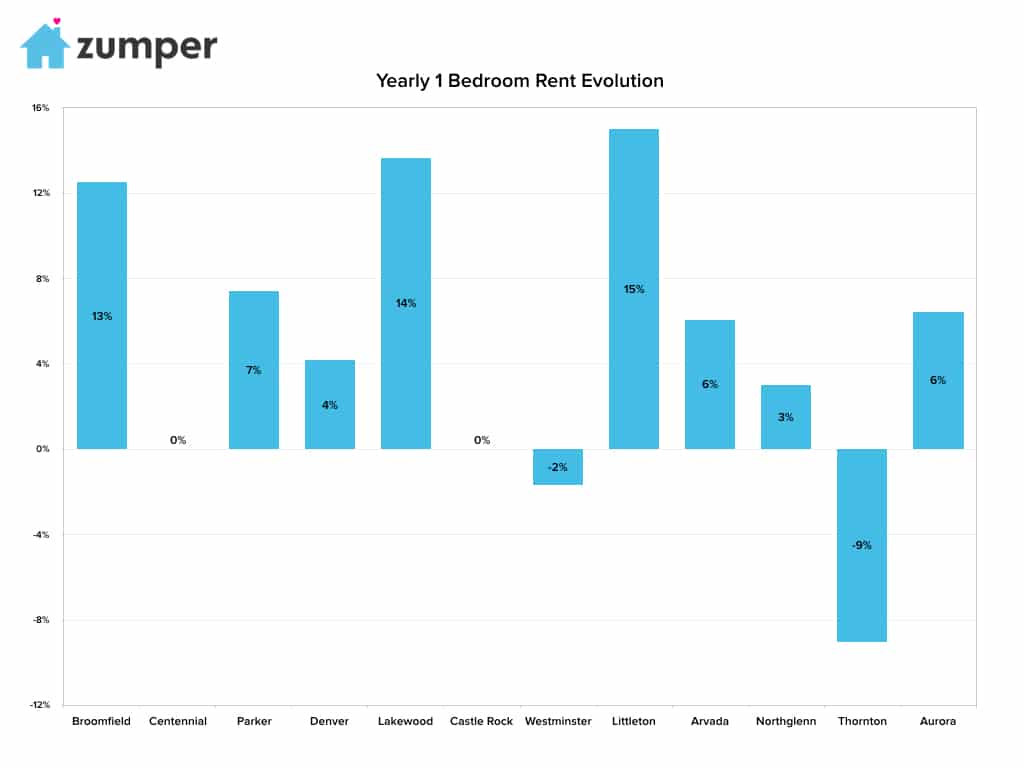
The Fastest Growing (Y/Y%)
–Littleton, CO had the fastest growing rent since last year, up 15%.
–Lakewood, CO rent was the second fastest growing, climbing 13.6% since this time last year.
–Broomfield, CO had the third largest yearly growth rate, up 12.5%.
The Fastest Growing (M/M%)
–Parker, CO rent was the fastest growing since last month, up 4.8%.
–Castle Rock, CO followed closely behind with a 4.3% monthly growth rate.
Full Data
| One Bedroom | Two Bedrooms | ||||||
|---|---|---|---|---|---|---|---|
| Pos. | City | Price | M/M % | Y/Y % | Price | M/M % | Y/Y % |
| 1 | Cambridge | $2,350 | -0.40% | -2.90% | $2,970 | 1.00% | -5.70% |
| 2 | Brookline | $2,290 | -0.40% | 4.10% | $2,800 | 2.60% | 3.70% |
| 3 | Boston | $2,200 | 0.00% | -3.50% | $2,600 | 0.00% | -0.80% |
| 4 | Somerville | $2,070 | -1.00% | 2.00% | $2,490 | 3.30% | 4.60% |
| 5 | Waltham | $2,030 | -1.90% | -7.70% | $2,390 | -3.20% | -5.50% |
| 6 | Medford | $1,920 | -0.50% | 5.50% | $2,260 | -1.70% | 2.70% |
| 7 | Newton | $1,880 | 4.40% | 1.60% | $2,300 | 0.00% | -0.90% |
| 8 | Quincy | $1,740 | -4.90% | -2.80% | $2,140 | -0.50% | 5.90% |
| 9 | Malden | $1,700 | 1.20% | 13.30% | $2,000 | 0.00% | 3.10% |
| 10 | Haverhill | $1,500 | -2.00% | 14.50% | $1,620 | 5.20% | 15.70% |
| 11 | Framingham | $1,450 | 0.00% | -1.40% | $1,730 | 1.20% | -3.90% |
| 12 | Lawrence | $1,400 | -2.80% | 14.80% | $1,460 | 1.40% | 9.80% |
| 13 | Lowell | $1,340 | 0.80% | -15.20% | $1,500 | 0.70% | -14.80% |
| 14 | Brockton | $1,250 | 1.60% | 14.70% | $1,550 | 0.00% | 14.80% |
| 15 | Worcester | $1,150 | 0.00% | -0.90% | $1,340 | 4.70% | -4.30% |
| 16 | Fall River | $840 | -3.40% | -15.20% | $1,050 | -4.50% | -9.50% |
About
The Zumper Denver Metro Report analyzed over 10,000 listings that hit the market in April 2017. Listings are aggregated by city to calculate median asking rents.
In the market for a new place? Search all Denver apartments for rent on Zumper now.
Stay up to date with Zumper by following us on Facebook, Gazouillement, Instagram, & Pinterest.
Contenu associé