The Zumper Denver Metro Report analyzed active listings in June across 12 metro cities to show the most and least expensive cities and cities with the fastest growing rents. The Colorado state median rent was $1,260 last month.
Cities Ranked By Rent
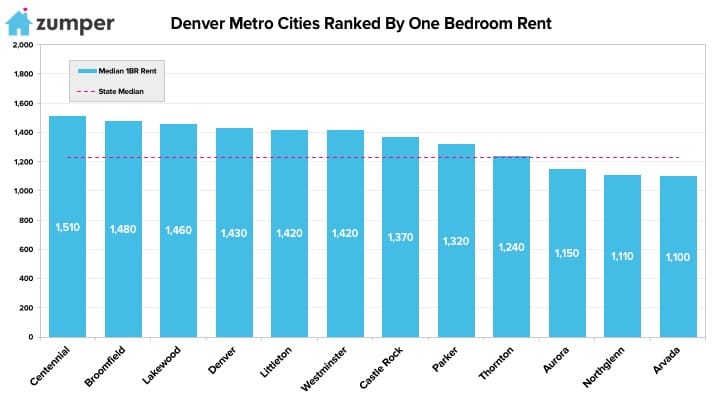
The Most Expensive
–Centennial, CO rent dropped $10 to $1,510 but remained the priciest in the metro.
–Broomfield, CO moved up 2 spots to rank as the second most expensive city with rent at $1,480.
–Lakewood, CO was third with one bedrooms priced at $1,460.
The Least Expensive
–Arvada, CO dropped behind Northglenn to rank as the most affordable city with rent at $1,100.
–Northglenn, CO followed closely behind as second with rent at $1,110.
–Aurora, CO saw rent climb $40 to $1,150, making it third.
Growth Rate
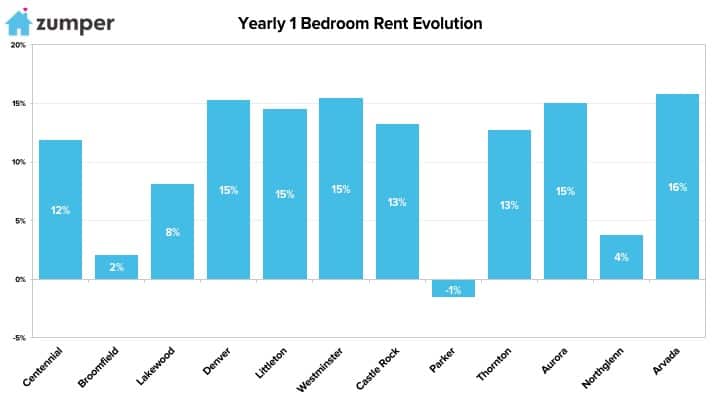
The Fastest Growing (Y/Y%)
–Arvada, CO had the fastest growing rent, up 15.8% since this time last year.
–Westminster, CO rent had the second largest year over year growth rate, up 15.4%.
–Denver, Colorado was third with rent rising 15.3%. 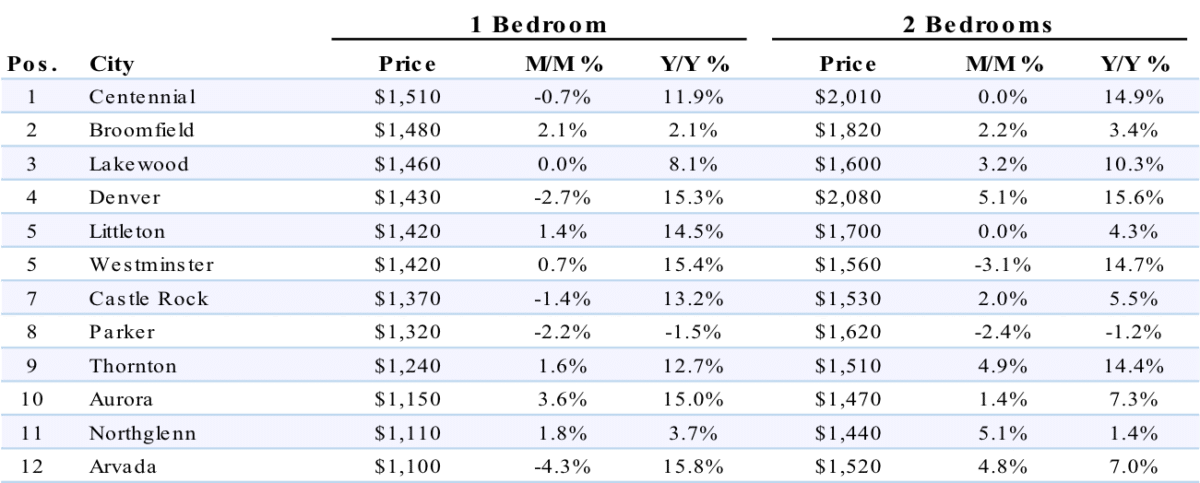
Full Data
| 1 Bedroom | 2 Bedrooms | ||||||
|---|---|---|---|---|---|---|---|
| Pos. | City | Price | M/M % | Y/Y % | Price | M/M % | Y/Y % |
| 1 | San Francisco | $3,500 | 0.30% | 1.40% | $4,680 | 1.70% | 4.00% |
| 2 | Mountain View | $3,400 | 0.9% | 11.1% | $4,320 | 0.90% | 15.20% |
| 3 | Redwood City | $3,160 | 5.00% | 6.40% | $4,040 | 4.90% | 10.70% |
| 4 | Sunnyvale | $3,060 | 5.20% | 14.20% | $3,850 | 4.10% | 15.60% |
| 5 | Emeryville | $3,000 | 3.10% | 11.50% | $3,830 | 1.60% | 3.50% |
| 6 | Santa Clara | $2,950 | 5.00% | 15.70% | $3,510 | -2.50% | 15.50% |
| 7 | Palo Alto | $2,820 | 0.00% | 3.70% | $3,700 | -0.80% | -15.90% |
| 8 | Milpitas | $2,740 | 5.00% | 13.20% | $3,120 | 1.00% | 13.90% |
| 9 | San Mateo | $2,660 | -0.70% | 1.90% | $3,690 | 1.70% | 6.60% |
| 10 | South San Francisco | $2,650 | 5.20% | 10.00% | $3,480 | 3.90% | 2.40% |
| 11 | Daly City | $2,570 | 3.20% | 13.20% | $3,250 | 0.60% | 9.40% |
| 12 | Union City | $2,560 | 4.90% | 15.80% | $2,610 | 4.80% | 4.00% |
| 13 | Berkeley | $2,500 | -0.80% | 0.00% | $3,470 | -0.60% | 0.00% |
| 14 | San Jose | $2,480 | -2.00% | 3.80% | $3,010 | -0.30% | 6.40% |
| 15 | Burlingame | $2,400 | -5.10% | 2.10% | $3,590 | 4.70% | 15.80% |
| 16 | Walnut Creek | $2,320 | -1.30% | 2.70% | $2,590 | 0.00% | -4.40% |
| 17 | Fremont | $2,300 | 0.90% | 4.50% | $2,620 | -0.80% | 2.30% |
| 18 | Pleasanton | $2,200 | -2.20% | 2.80% | $2,670 | -3.60% | 4.70% |
| 19 | Alameda | $2,180 | 4.80% | 14.70% | $2,660 | -1.50% | 2.30% |
| 20 | San Ramon | $2,120 | 1.00% | 1.90% | $2,620 | 4.80% | 1.20% |
| 21 | Oakland | $2,100 | -3.20% | 0.00% | $2,480 | -0.80% | -0.80% |
| 22 | Hayward | $1,960 | -0.50% | 4.80% | $2,400 | 0.00% | 6.70% |
| 23 | San Leandro | $1,900 | 1.60% | 1.60% | $2,340 | 1.30% | 1.30% |
| 24 | Petaluma | $1,870 | -4.60% | -9.20% | $2,520 | -3.10% | 1.60% |
| 25 | Livermore | $1,790 | -1.60% | 5.90% | $2,270 | -1.70% | 0.00% |
| 25 | Richmond | $1,790 | 0.00% | -1.10% | $2,170 | 0.00% | 1.40% |
| 27 | Napa | $1,760 | 4.80% | 14.30% | $2,000 | -4.30% | -11.90% |
| 28 | Concord | $1,700 | 3.00% | 6.30% | $2,020 | -1.50% | 9.20% |
| 29 | Santa Rosa | $1,560 | -0.60% | 0.60% | $2,160 | 3.30% | 8.50% |
| 30 | Vallejo | $1,350 | 0.00% | 6.30% | $1,610 | -0.60% | 0.60% |
About
The Zumper Denver Metro Report analyzed active listings that hit the market last month. Listings are aggregated by city to calculate median asking rents.
In the market for a new place? Search all Denver apartments for rent on Zumper now.
Contenu associé