The Zumper Dallas Metro Report analyzed active listings in June across 14 metro cities to show the most and least expensive cities and cities with the fastest growing rents.
Cities Ranked By Rent
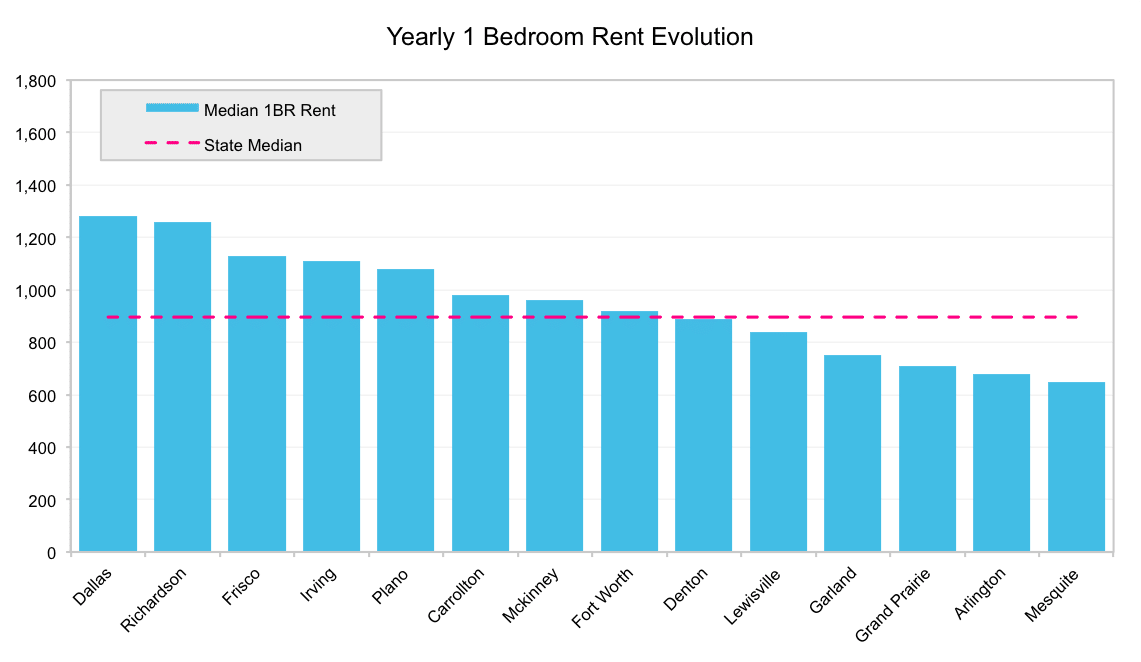
The Most Expensive
–Dallas, Texas ranked as the most expensive city to rent in the metro area with median rent at $1,280.
–Richardson, TX rent remained flat at $1,260, ranking as the second priciest city.
–Frisco, TX ranked as the third most expensive city to rent. The median price of one bedroom units was $1,130, remaining the same as the previous month.
The Least Expensive
–Mesquite, TX was the most affordable city to rent with the median priced at $650.
–Arlington, TX rent was the second least expensive in the metro area at $680.
–Grand Prairie, TX ranked as the third most affordable city with rent at $710, experiencing a 2.9% monthly growth rate.
Yearly Growth Rate
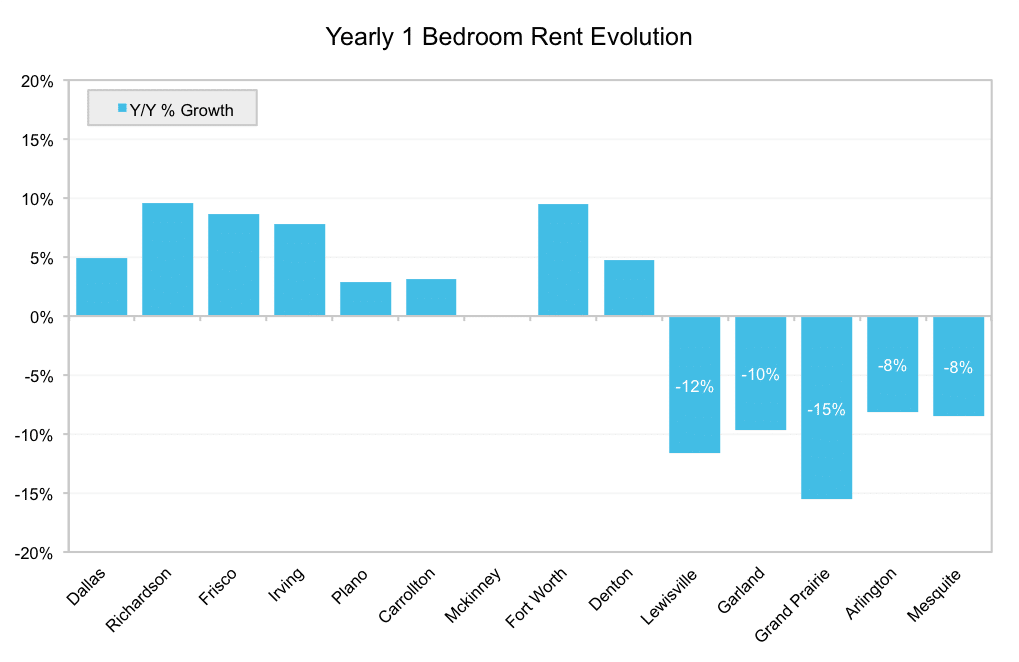
The Fastest Growing (Y/Y%)
–Richardson, TX had the largest yearly growth rate at 9.6%.
–Fort Worth, TX rent grew 9.5% since last year, making it the second fastest growing
–Frisco, TX was the third fastest growing, with a yearly growth rate of 8.7%.
The Fastest Growing (M/M%)
–Grand Prairie, TX had the fastest growing rent since last month, climbing 2.9%.
–Denton, TX ranked as second with rent growing 2.3% since last month.
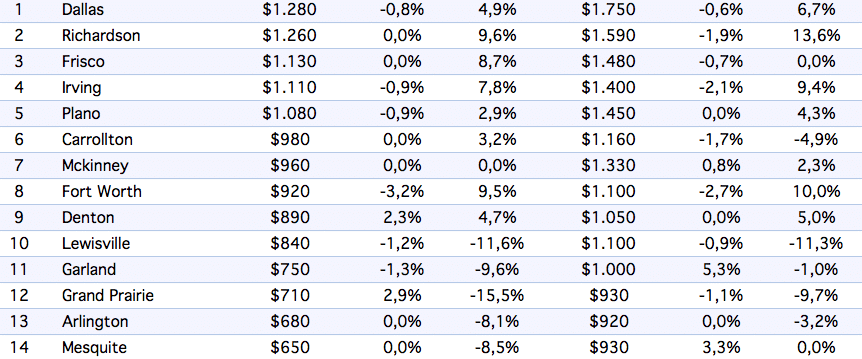
Full Data
| Pos. | City | Price | M/M % | Y/Y % | Price | M/M % | Y/Y % |
|---|---|---|---|---|---|---|---|
| 1 | West Linn | $1.470 | 3,5% | 0,0% | $1.810 | 5,2% | -9,5% |
| 2 | Portland | $1.350 | -0,7% | -3,6% | $1.590 | -0,6% | -4,2% |
| 3 | Lake Oswego | $1.290 | 2,4% | 4,9% | $1.560 | 4,7% | 4,7% |
| 4 | Gladstone | $1.250 | 0,0% | 12,6% | $1.360 | -2,9% | 15,3% |
| 5 | Happy Valley | $1.240 | 2,5% | 15,9% | $1.390 | 0,7% | 4,5% |
| 5 | Hillsboro | $1.240 | -4,6% | -12,1% | $1.530 | 2,7% | -4,4% |
| 5 | Tualatin | $1.240 | -3,9% | -1,6% | $1.340 | 3,1% | 3,1% |
| 6 | Wilsonville | $1.220 | 4,3% | -1,6% | $1.410 | -0,7% | -7,2% |
| 7 | Beaverton | $1.170 | 1,7% | 0,9% | $1.330 | 0,0% | 0,0% |
| 8 | Milwaukie | $1.090 | 4,8% | 7,9% | $1.310 | -1,5% | 7,4% |
| 9 | Gresham | $1.020 | -1,0% | 2,0% | $1.150 | -2,5% | -4,2% |
| 10 | Tigard | $1.000 | -2,9% | -2,0% | $1.180 | 2,6% | -1,7% |
| 11 | Oregon City | $950 | -5,0% | 5,6% | $1.270 | 5,0% | 5,8% |
| 12 | Forest Grove | $940 | 0,0% | 11,9% | $1.110 | -5,1% | 6,7% |
About
The Zumper Dallas Metro Report analyzed active listings that hit the market in June 2017. Listings are aggregated by city to calculate median asking rents.
In the market for a new place? Search all Dallas apartments for rent on Zumper now.
Stay up to date with Zumper by following us on Facebook, Gazouillement, Instagram, & Pinterest
Contenu associé