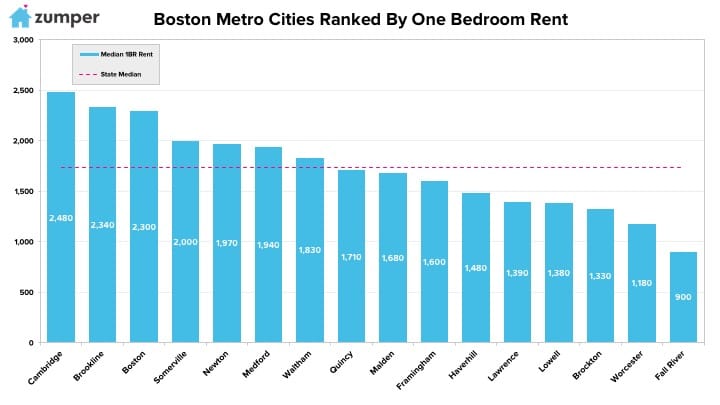
The Zumper Boston Metro Report analyzed active listings in February across 16 metro cities to show the most and least expensive cities and cities with the fastest growing rents. The state median one bedroom rent was $1,735 last month.
Cities Ranked By Rent
Le plus cher
–Cambridge, MA ranked as the most expensive city to rent with one bedrooms priced at $2,480.
–Brookline, MA rent was priced at $2,340, remaining the second priciest in the metro.
–Boston, Massachusetts continued to rank as third with rent at $2,300.
Le moins cher
–Fall River, MA rent grew $20 to $900 but stayed the most affordable in the metro.
–Worcester, MA was the second least expensive city with one bedrooms priced at $1,180.
–Brockton, MA fell behind Lawrence and Lowell to rank as the third most affordable city with rent at $1,330.
Growth Rate
La croissance la plus rapide (Y/Y%)
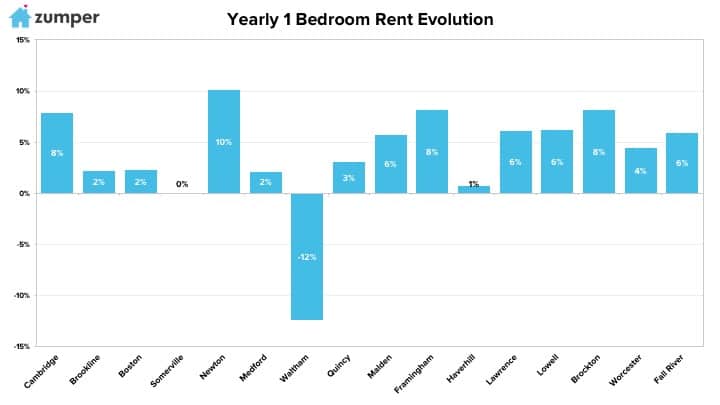
–Newton, MA had the largest year over year rental growth rate, up 10.1%.
–Framingham & Brockton, MA tied for second with prices both climbing 8.1%.
La croissance la plus rapide (M/M%)
–Newton, MA also had a large monthly rental growth rate, increasing 4.8%.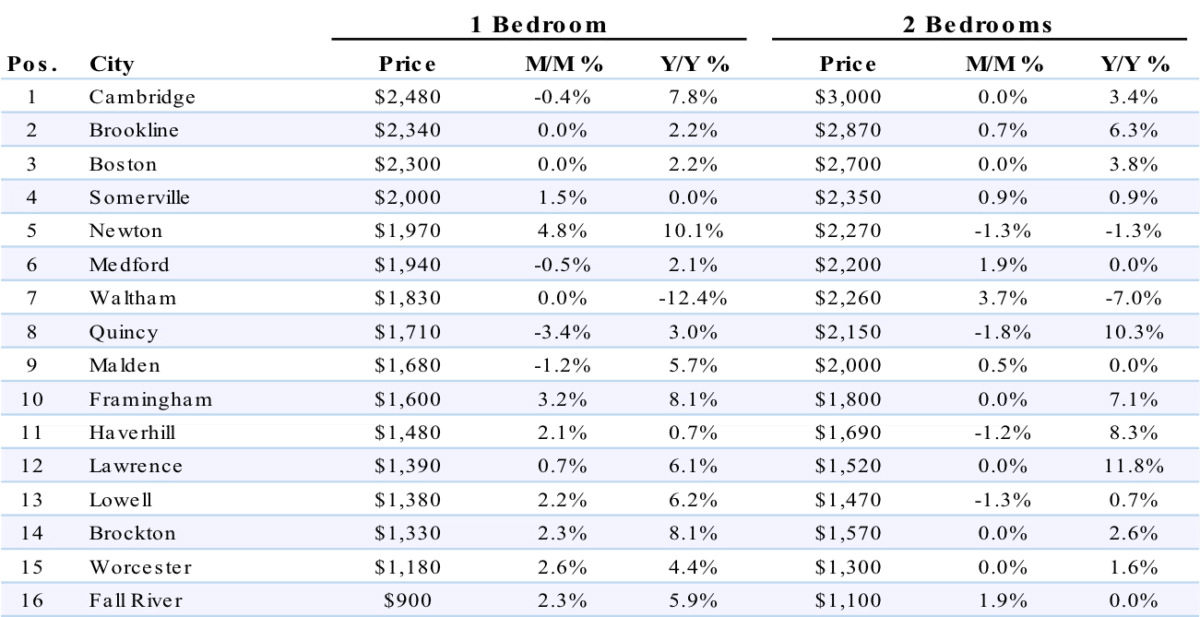
Full Data
| 1 Bedroom | 2 Bedrooms | ||||||
|---|---|---|---|---|---|---|---|
| Pos. | City | Price | M/M % | Y/Y % | Price | M/M % | Y/Y % |
| 1 | Cambridge | $2,480 | 0.00% | 5.50% | $3,080 | 2.70% | 5.50% |
| 2 | Brookline | $2,330 | -0.40% | 3.60% | $2,850 | -0.70% | 5.60% |
| 3 | Boston | $2,300 | 0.00% | 4.50% | $2,700 | 0.00% | 3.80% |
| 4 | Somerville | $2,000 | 0.00% | -3.80% | $2,470 | 5.10% | 3.30% |
| 5 | Medford | $1,960 | 1.00% | 5.90% | $2,300 | 4.50% | 1.30% |
| 6 | Waltham | $1,920 | 4.90% | -5.00% | $2,370 | 4.90% | -3.30% |
| 7 | Newton | $1,870 | -5.10% | 3.90% | $2,300 | 1.30% | 0.00% |
| 8 | Quincy | $1,800 | 5.30% | 3.40% | $2,230 | 3.70% | 8.80% |
| 9 | Malden | $1,650 | -1.80% | 3.10% | $2,080 | 4.00% | 4.00% |
| 10 | Framingham | $1,610 | 0.60% | 9.50% | $1,840 | 2.20% | 5.10% |
| 11 | Haverhill | $1,550 | 4.70% | 3.30% | $1,770 | 4.70% | 11.30% |
| 12 | Lowell | $1,450 | 5.10% | 12.40% | $1,540 | 4.80% | 4.80% |
| 13 | Lawrence | $1,440 | 3.60% | 5.10% | $1,600 | 5.30% | 11.90% |
| 14 | Brockton | $1,300 | -2.30% | 5.70% | $1,610 | 2.50% | 3.90% |
| 15 | Worcester | $1,240 | 5.10% | 9.70% | $1,360 | 4.60% | 6.30% |
| 16 | Fall River | $940 | 4.40% | 11.90% | $1,150 | 4.50% | 9.50% |
À propos
The Zumper Boston Metro Report analyzed active listings that hit the market in February 2018. Listings are aggregated by city to calculate median asking rents.
In the market for a new place? Search all Boston apartments for rent on Zumper now.
Stay up to date with Zumper by following us on Facebook, Gazouillement, Instagram, & Pinterest.
Contenu associé


