The Zumper Boston Metro Report analyzed active listings in May across 16 metro cities to show the most and least expensive cities and cities with the fastest growing rents. The state median one bedroom rent was $1,868 last month.
Cities Ranked By Rent
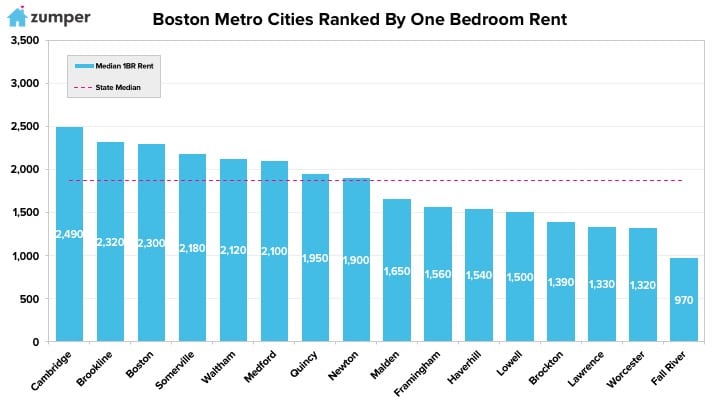
Le plus cher
–Cambridge, MA continued to be the priciest city with one bedroom rent ticking up slightly to $2,490 last month.
–Brookline, MA was second with rent at $2,320.
–Boston, Massachusetts followed closely behind as third with one bedrooms priced at $2,300.
Le moins cher
–Fall River, MA rent stayed the most affordable in the metro and below $1,000 last month at $970.
–Worcester, MA saw rent grow $60 to $1,320 but remained the second least expensive.
–Lawrence, MA fell one spot to rank as the third most affordable with rent at $1,330.
Growth Rate
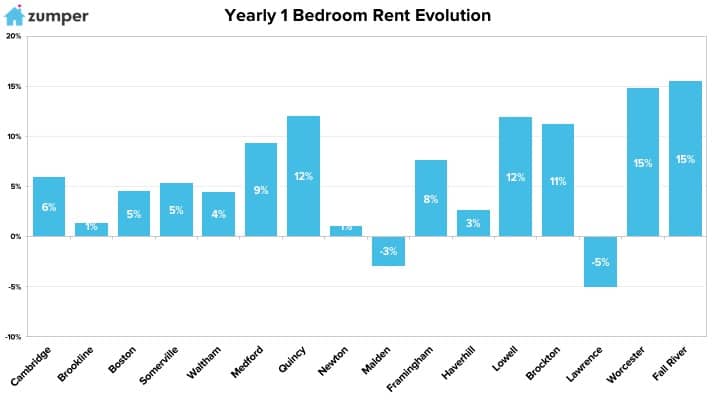
La croissance la plus rapide (Y/Y%)
–Fall River, MA had the fastest growing rent since this time last year, up 15.5%.
–Worcester, MA was second with prices climbing 14.8%.
–Quincy, MA rent had the third largest year over year growth rate, increasing 12.1%.
La croissance la plus rapide (M/M%)
–Waltham & Medford, MA tied for having the fastest growing rent last month, both with prices up 5%.
–Somerville & Worcester, MA tied for second with rents both jumping 4.8%.
–Fall River, MA rent ranked as third fastest growing, climbing 4.3% last month.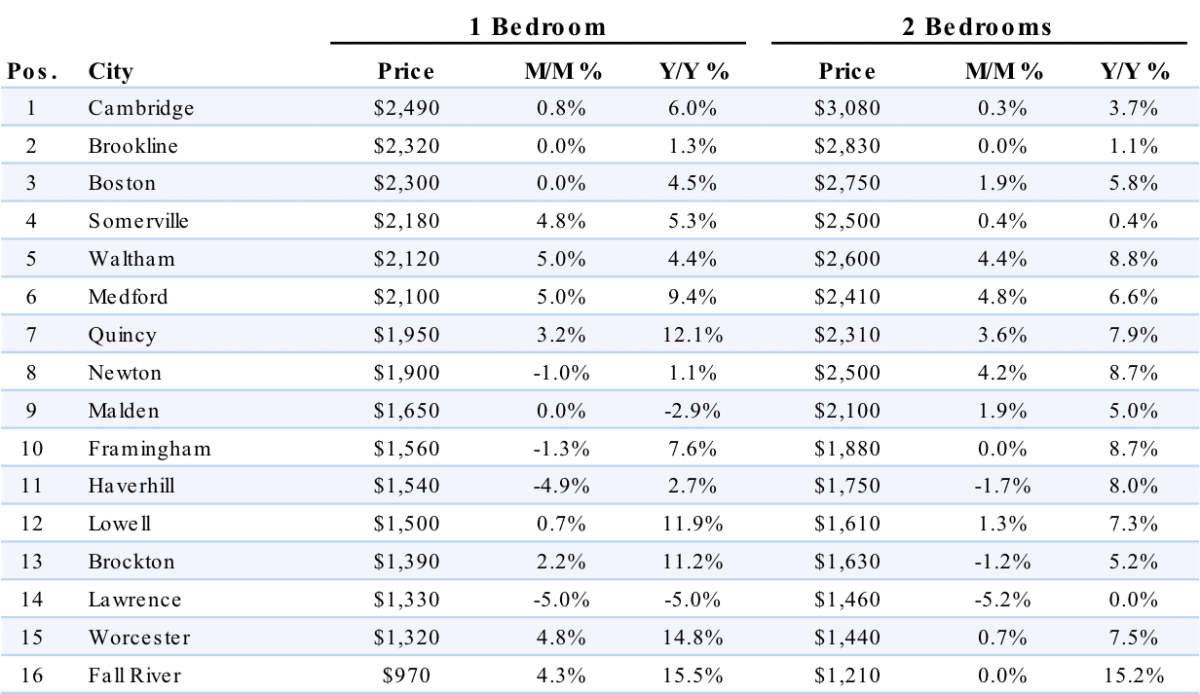
Full Data
| 1 Bedroom | 2 Bedrooms | ||||||
|---|---|---|---|---|---|---|---|
| Pos. | City | Price | M/M % | Y/Y % | Price | M/M % | Y/Y % |
| 1 | San Francisco, Californie | $3,500 | 0.30% | 1.40% | $4,680 | 1.70% | 4.00% |
| 2 | New York, NY | $2,860 | 0.00% | -3.10% | $3,220 | 0.60% | -3.90% |
| 3 | San Jose, CA | $2,480 | -2.00% | 3.80% | $3,010 | -0.30% | 6.40% |
| 4 | Los Angeles, Californie | $2,360 | 0.90% | 12.40% | $3,310 | 0.60% | 10.30% |
| 5 | Boston, Massachusetts | $2,320 | 0.90% | 5.50% | $2,750 | 0.00% | 4.60% |
| 6 | Washington, D.C. | $2,160 | 0.90% | -2.30% | $2,770 | 3.40% | -15.80% |
| 7 | Oakland, CA | $2,100 | -3.20% | 0.00% | $2,480 | -0.80% | -0.80% |
| 8 | Seattle, WA | $1,990 | 0.00% | 4.20% | $2,530 | 0.40% | 1.20% |
| 9 | San Diego, CA | $1,820 | -1.10% | 15.20% | $2,410 | 0.40% | 9.50% |
| 10 | Miami, Floride | $1,800 | 0.00% | 0.00% | $2,500 | 1.20% | 0.00% |
| 11 | Honolulu, HI | $1,700 | -1.70% | -5.60% | $2,200 | 0.00% | -4.30% |
| 12 | Santa Ana, CA | $1,690 | -1.70% | 10.50% | $2,080 | -1.90% | 15.60% |
| 13 | Anaheim, CA | $1,620 | -0.60% | 5.20% | $2,100 | -1.90% | 11.70% |
| 14 | Long Beach, CA | $1,610 | 1.90% | 15.00% | $2,090 | -5.00% | 14.20% |
| 15 | Fort Lauderdale, FL | $1,530 | -5.00% | -0.60% | $2,050 | -1.40% | 7.90% |
| 16 | Chicago, Illinois | $1,500 | 0.00% | -10.20% | $1,810 | -4.70% | -15.80% |
| 16 | Philadelphie, Pennsylvanie | $1,500 | 0.70% | 7.90% | $1,700 | 0.00% | 6.90% |
| 18 | Portland, Oregon | $1,460 | 0.70% | 7.40% | $1,790 | 2.30% | 11.90% |
| 19 | Atlanta, Géorgie | $1,440 | 1.40% | 14.30% | $1,810 | 0.00% | 13.10% |
| 19 | Providence, RI | $1,440 | -5.30% | 6.70% | $1,520 | -4.40% | 7.80% |
| 21 | Denver, Colorado | $1,430 | -2.70% | 15.30% | $2,080 | 5.10% | 15.60% |
| 22 | Minneapolis, MN | $1,420 | 0.70% | 15.40% | $1,810 | -2.20% | 4.60% |
| 23 | New Orleans, LA | $1,400 | -0.70% | 5.30% | $1,590 | 2.60% | -0.60% |
| 24 | Baltimore, MD | $1,330 | -5.00% | 0.00% | $1,610 | 0.00% | 9.50% |
| 24 | Dallas, Texas | $1,330 | 1.50% | 3.90% | $1,780 | -0.60% | 1.70% |
| 24 | Nashville, TN | $1,330 | -4.30% | 15.70% | $1,470 | 0.00% | 5.00% |
| 27 | Houston, Texas | $1,280 | -1.50% | 13.30% | $1,650 | 2.50% | 15.40% |
| 27 | Madison, WI | $1,280 | -1.50% | 9.40% | $1,410 | 1.40% | 15.60% |
| 29 | Scottsdale, AZ | $1,250 | 0.00% | 4.20% | $1,880 | -0.50% | -6.00% |
| 30 | Charlotte, Caroline du Nord | $1,240 | -0.80% | 9.70% | $1,360 | -0.70% | 5.40% |
| 30 | Orlando, Floride | $1,240 | -2.40% | 14.80% | $1,470 | 0.70% | 15.70% |
| 32 | Sacramento, CA | $1,230 | 3.40% | 7.90% | $1,440 | 2.90% | 15.20% |
| 33 | Austin, Texas | $1,190 | 0.80% | 14.40% | $1,470 | 0.00% | 11.40% |
| 34 | Irving, TX | $1,170 | 0.90% | 5.40% | $1,620 | 4.50% | 15.70% |
| 35 | Tampa, Floride | $1,160 | 1.80% | 10.50% | $1,380 | 0.00% | 12.20% |
| 36 | Aurora, CO | $1,150 | 3.60% | 15.00% | $1,470 | 1.40% | 7.30% |
| 36 | Plano, TX | $1,150 | 1.80% | 6.50% | $1,540 | 2.00% | 6.20% |
| 38 | Durham, NC | $1,120 | 1.80% | 15.50% | $1,290 | 1.60% | 15.20% |
| 39 | Newark, NJ | $1,110 | 0.90% | 14.40% | $1,390 | 0.70% | 15.80% |
| 40 | Pittsburgh, PA | $1,100 | 0.00% | -3.50% | $1,350 | 0.00% | -6.30% |
| 41 | Gilbert, AZ | $1,090 | 0.00% | 10.10% | $1,360 | 0.00% | 1.50% |
| 42 | Henderson, NV | $1,070 | 1.90% | 9.20% | $1,250 | 2.50% | 12.60% |
| 42 | St Petersburg, FL | $1,070 | -0.90% | 12.60% | $1,540 | -0.60% | 7.70% |
| 44 | Buffalo, NY | $1,060 | -2.80% | 15.20% | $1,330 | 4.70% | 2.30% |
| 44 | Richmond, VA | $1,060 | 1.00% | 10.40% | $1,280 | 1.60% | 6.70% |
| 46 | Chandler, AZ | $1,050 | 0.00% | 9.40% | $1,250 | -2.30% | 7.80% |
| 46 | Fort Worth, TX | $1,050 | -3.70% | 14.10% | $1,270 | -2.30% | 15.50% |
| 48 | Chesapeake, VA | $1,040 | 3.00% | 7.20% | $1,200 | 0.00% | 4.30% |
| 48 | Salt Lake City, UT | $1,040 | -1.00% | 15.60% | $1,380 | -0.70% | 15.00% |
| 50 | Virginia Beach, VA | $1,020 | -1.90% | 5.20% | $1,200 | 0.00% | 1.70% |
| 51 | Raleigh, NC | $1,010 | 1.00% | 1.00% | $1,200 | 1.70% | 4.30% |
| 52 | Phoenix, Arizona | $980 | 0.00% | 11.40% | $1,200 | 0.80% | 11.10% |
| 53 | Jacksonville, FL | $950 | 0.00% | 9.20% | $1,100 | 0.90% | 0.00% |
| 53 | Kansas City, MO | $950 | -2.10% | 15.90% | $1,100 | 0.90% | 8.90% |
| 55 | Las Vegas, Nevada | $920 | 1.10% | 15.00% | $1,100 | 0.00% | 12.20% |
| 55 | Milwaukee, WI | $920 | -1.10% | 15.00% | $1,120 | 2.80% | 15.50% |
| 57 | Boise, ID | $910 | 1.10% | 5.80% | $970 | 2.10% | 9.00% |
| 57 | Mesa, AZ | $910 | 0.00% | 13.80% | $1,080 | -1.80% | 10.20% |
| 57 | Syracuse, NY | $910 | 3.40% | 15.20% | $1,070 | 3.90% | 8.10% |
| 60 | Colorado Springs, CO | $900 | -2.20% | 15.40% | $1,100 | -4.30% | 0.00% |
| 60 | San Antonio, TX | $900 | 1.10% | 9.80% | $1,170 | 1.70% | 12.50% |
| 62 | Fresno, CA | $890 | 0.00% | 4.70% | $1,080 | -0.90% | 8.00% |
| 63 | Baton Rouge, LA | $870 | -3.30% | 8.70% | $940 | -2.10% | 2.20% |
| 63 | Des Moines, IA | $870 | 3.60% | 10.10% | $910 | 3.40% | 2.20% |
| 65 | Anchorage, AK | $860 | 0.00% | -4.40% | $1,070 | -3.60% | -10.80% |
| 65 | Corpus Christi, TX | $860 | 1.20% | -4.40% | $1,090 | 0.00% | 9.00% |
| 65 | Laredo, TX | $860 | 0.00% | 14.70% | $970 | -2.00% | 14.10% |
| 68 | Louisville, KY | $850 | 0.00% | 7.60% | $960 | -2.00% | 15.70% |
| 68 | Omaha, NE | $850 | 0.00% | 10.40% | $1,060 | 1.00% | 15.20% |
| 70 | Rochester, NY | $840 | 0.00% | 15.10% | $1,000 | 2.00% | 14.90% |
| 71 | Norfolk, VA | $830 | 2.50% | 15.30% | $1,000 | 3.10% | 11.10% |
| 72 | Cincinnati, OH | $820 | 0.00% | 15.50% | $1,060 | -4.50% | 15.20% |
| 72 | Knoxville, TN | $820 | 5.10% | 15.50% | $930 | 1.10% | 13.40% |
| 72 | Reno, NV | $820 | -3.50% | 15.50% | $1,200 | -5.50% | 15.40% |
| 75 | St Louis, MO | $810 | 5.20% | 15.70% | $1,140 | 1.80% | 14.00% |
| 76 | Lexington, KY | $800 | 2.60% | 1.30% | $950 | 0.00% | 1.10% |
| 77 | Arlington, TX | $780 | 0.00% | 14.70% | $1,050 | -0.90% | 14.10% |
| 77 | Cleveland, OH | $780 | -2.50% | 14.70% | $890 | 1.10% | 15.60% |
| 77 | Winston Salem, NC | $780 | 2.60% | 14.70% | $820 | 0.00% | 15.50% |
| 80 | Bakersfield, CA | $770 | -1.30% | 5.50% | $900 | 0.00% | 0.00% |
| 80 | Columbus, Ohio | $770 | 5.50% | 10.00% | $1,070 | 1.90% | 11.50% |
| 82 | Chattanooga, TN | $760 | 0.00% | 15.20% | $810 | 0.00% | 6.60% |
| 83 | Augusta, GA | $750 | -1.30% | 15.40% | $850 | 1.20% | 9.00% |
| 83 | Glendale, AZ | $750 | 1.40% | 8.70% | $1,000 | 4.20% | 11.10% |
| 85 | Greensboro, NC | $740 | 4.20% | 12.10% | $840 | 0.00% | 3.70% |
| 86 | Memphis, TN | $730 | 2.80% | 14.10% | $770 | 0.00% | 14.90% |
| 86 | Spokane, WA | $730 | 4.30% | 12.30% | $900 | 4.70% | 4.70% |
| 86 | Tallahassee, FL | $730 | -2.70% | 15.90% | $850 | 0.00% | 10.40% |
| 89 | Lincoln, NE | $700 | 4.50% | 0.00% | $930 | 4.50% | 6.90% |
| 89 | Oklahoma City, OK | $700 | 2.90% | 11.10% | $820 | -1.20% | 9.30% |
| 91 | Indianapolis, IN | $690 | 0.00% | 15.00% | $820 | 1.20% | 15.50% |
| 92 | Albuquerque, NM | $660 | 1.50% | 6.50% | $850 | 1.20% | 9.00% |
| 93 | El Paso, TX | $640 | 0.00% | 3.20% | $770 | 1.30% | 2.70% |
| 93 | Shreveport, LA | $640 | 0.00% | 14.30% | $740 | 4.20% | 13.80% |
| 95 | Tucson, AZ | $630 | 0.00% | -1.60% | $850 | 2.40% | 0.00% |
| 96 | Wichita, KS | $620 | -1.60% | 14.80% | $750 | 1.40% | 13.60% |
| 97 | Detroit, MI | $610 | 0.00% | 15.10% | $680 | -1.40% | 13.30% |
| 97 | Tulsa, OK | $610 | 1.70% | 3.40% | $770 | 1.30% | 5.50% |
| 99 | Akron, OH | $600 | 0.00% | 11.10% | $760 | 2.70% | 13.40% |
| 99 | Lubbock, TX | $600 | 1.70% | 9.10% | $790 | 1.30% | 5.30% |
À propos
The Zumper Boston Metro Report analyzed active listings that hit the market last month. Listings are aggregated by city to calculate median asking rents.
In the market for a new place? Search all Boston apartments for rent on Zumper now.
Stay up to date with Zumper by following us on Facebook, Gazouillement, Instagram, & Pinterest.
Contenu associé


