The Zumper Boston Metro Report analyzed active listings in June across 16 metro cities to show the most and least expensive cities and cities with the fastest growing rents. The state median one bedroom rent was $1,854 last month.
Cities Ranked By Rent
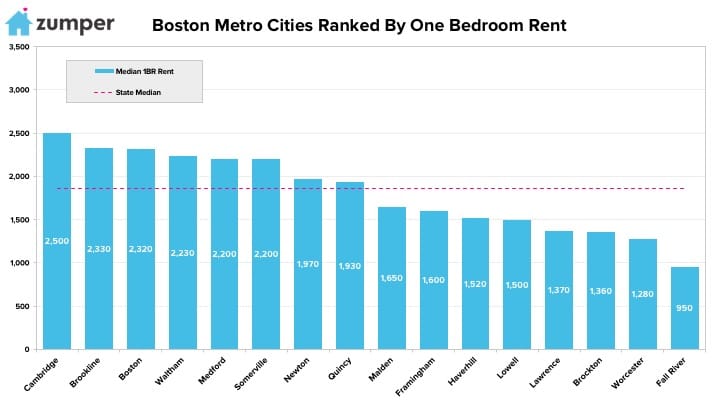
Le plus cher
–Cambridge, MA saw rent climb $10 to $2,500 last month and continue to rank as the most expensive in the metro.
–Brookline, MA stayed as second, though rent rose $10 to $2,320.
–Boston, Massachusetts was third with one bedrooms priced at $2,320.
Le moins cher
–Fall River, MA was the most affordable city with rent at $950.
–Worcester, MA rent dropped $40 to $1,280 but continued to be the second least expensive.
–Brockton, MA fell behind Lawrence to become the third most affordable with rent dropping $30 to $1,360.
Growth Rate
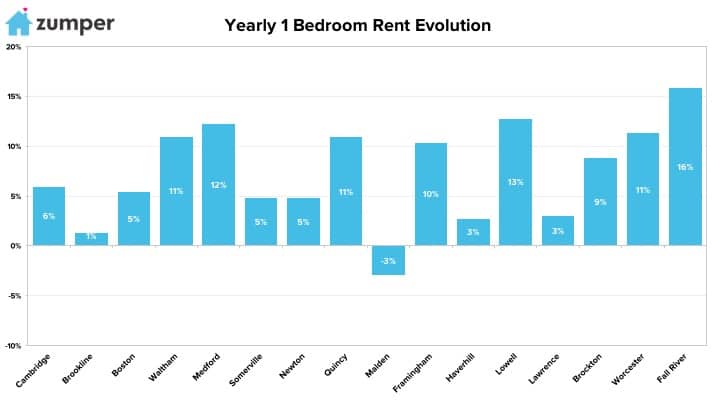
La croissance la plus rapide (Y/Y%)
–Fall River, MA, similar to last month, had the fastest growing rent since this time last year, up 15.9%.
–Lowell, MA rent rose 12.8% since this time last year, making it second.
–Medford, MA was third with rent jumping 12.2%.
La croissance la plus rapide (M/M%)
–Waltham, MA had the largest monthly rental growth rate, climbing 5.2%.
–Medford, MA ranked as second with rent growing 4.8%.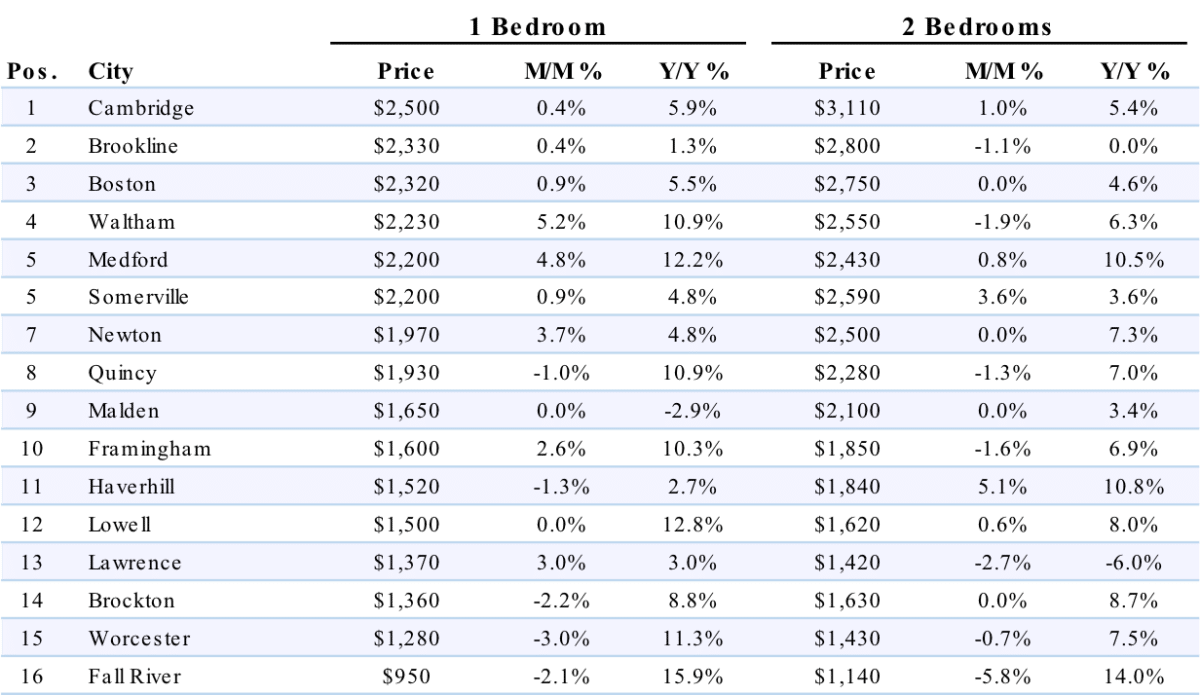
Full Data
| Rank | City | State | Region | Price Per Add'l Room | % of Income Spent on Rent | Monthly Housing Costs | Median House-hold Income | UE | Infant Care | % of Popul-ation Under 45 | Drop-out Rate | Com-mute | Crime | Score |
|---|---|---|---|---|---|---|---|---|---|---|---|---|---|---|
| 1 | Madison | WI | Midwest | 8.2 | 5.4 | 9.1 | 8.3 | 9.8 | 3.8 | 9.1 | 10 | 9.3 | 9.2 | 100 |
| 2 | Lincoln | NE | Midwest | 4.6 | 3.8 | 10 | 6.5 | 8.3 | 9.1 | 6.6 | 9.6 | 9.9 | 8.8 | 93.9 |
| 3 | Lexington | KY | South | 7.6 | 3.6 | 9.9 | 6.2 | 6.3 | 9.7 | 5.5 | 9.3 | 7.8 | 9.3 | 91.5 |
| 4 | Boise | ID | West | 9.6 | 2.4 | 9.3 | 7.1 | 8.9 | 9.3 | 2.6 | 6.2 | 9.9 | 9.5 | 91.0 |
| 5 | Tallahassee | FL | South | 8.5 | 9.7 | 6.8 | 2.8 | 6.6 | 6.4 | 10 | 9.2 | 9.9 | 2.1 | 87.6 |
| 6 | Raleigh | NC | South | 6.2 | 2.4 | 9.8 | 8.7 | 6.6 | 5.6 | 8.6 | 8.7 | 6 | 8.5 | 86.5 |
| 7 | Omaha | NE | Midwest | 5.4 | 3.3 | 8.9 | 6.3 | 8 | 9.1 | 4.4 | 7.7 | 9.3 | 7.6 | 85.2 |
| 8 | Des Moines | IA | Midwest | 10 | 3.6 | 8.9 | 4.9 | 9.8 | 5.7 | 5.8 | 5.9 | 9.3 | 4.7 | 83.5 |
| 9 | Austin | TX | South | 3.8 | 3.6 | 6.6 | 8.9 | 8 | 8.9 | 9.5 | 5.6 | 4.8 | 8.7 | 83.2 |
| 10 | Lubbock | TX | South | 6.2 | 7.1 | 8.9 | 4.2 | 8 | 8.9 | 8.7 | 3.6 | 10 | 2.7 | 83.1 |
| 11 | Charlotte | NC | South | 8.5 | 1.7 | 7.8 | 8 | 8.9 | 5.6 | 7.8 | 7.9 | 3.8 | 5.1 | 79.2 |
| 12 | Fort Worth | TX | South | 5.1 | 2.7 | 8.4 | 7.6 | 10 | 8.9 | 9 | 3.4 | 2.5 | 7.2 | 78.8 |
| 13 | Columbus | OH | Midwest | 3.5 | 1.4 | 8.2 | 4.7 | 9.5 | 7.4 | 8.6 | 7.4 | 7.1 | 7 | 78.8 |
| 14 | Virginia Beach | VA | South | 6.5 | 5 | 3.4 | 9.2 | 7.1 | 4.8 | 2.9 | 9.9 | 6 | 9.9 | 78.7 |
| 15 | Laredo | TX | South | 8.9 | 9.1 | 2.3 | 2.4 | 4.2 | 8.9 | 9.9 | 2.6 | 7.8 | 8.6 | 78.7 |
| 16 | Durham | NC | South | 6.9 | 2.9 | 9.2 | 6.9 | 6.3 | 5.6 | 7.8 | 8.2 | 6 | 4 | 77.6 |
| 17 | Norfolk | VA | South | 6.9 | 8.2 | 2 | 4.1 | 7.1 | 4.8 | 8.9 | 7 | 7.1 | 7.1 | 76.9 |
| 18 | Greensboro | NC | South | 9.2 | 4.3 | 6.2 | 3.3 | 8.4 | 5.6 | 3.9 | 7.3 | 8.5 | 6.1 | 76.4 |
| 19 | Bakersfield | CA | West | 8.2 | 6.1 | 4.1 | 8.8 | 0.6 | 2.1 | 9.4 | 8.6 | 6 | 7.8 | 75.1 |
| 20 | Colorado Springs | CO | West | 5.7 | 4.4 | 7 | 8.1 | 8 | 0.9 | 4 | 7.5 | 7.8 | 8.2 | 74.9 |
| 21 | Baton Rouge | LA | South | 9.5 | 9 | 5.7 | 2.6 | 1.9 | 10 | 6.3 | 5.7 | 7.1 | 3.8 | 74.9 |
| 22 | Arlington | TX | South | 4.1 | 5.4 | 8.4 | 7.3 | 5.5 | 8.9 | 7.1 | 4.3 | 2.5 | 7.7 | 74.5 |
| 23 | Plano | TX | South | 2.4 | 0.7 | 9.7 | 9.8 | 5.5 | 8.9 | 1.3 | 9.8 | 3 | 9.8 | 74.1 |
| 24 | Knoxville | TN | South | 8.9 | 5.4 | 7.1 | 1.3 | 8.2 | 7 | 5 | 6 | 8.5 | 3.2 | 73.7 |
| 25 | Syracuse | NY | Northeast | 7.3 | 8.7 | 9.5 | 1 | 2.1 | 2.6 | 7 | 6.9 | 9.9 | 4.2 | 72.0 |
| 26 | Augusta | GA | South | 9.2 | 7.8 | 3.9 | 2.3 | 4.2 | 9.5 | 3.9 | 0.7 | 8.5 | 9.1 | 71.9 |
| 27 | El Paso | TX | South | 8.2 | 2.9 | 5.3 | 3.7 | 2.1 | 8.9 | 6.3 | 6.5 | 6 | 8.9 | 71.5 |
| 28 | Chattanooga | TN | South | 9.7 | 4.3 | 6.6 | 3 | 7.1 | 7 | 1.1 | 7.6 | 9.3 | 2.5 | 70.8 |
| 29 | Minneapolis | MN | Midwest | 2.4 | 3.3 | 7.6 | 7.2 | 9.5 | 2.7 | 9.3 | 7.8 | 6 | 2.2 | 70.6 |
| 30 | Nashville | TN | South | 7.7 | 2.5 | 6 | 5.7 | 9.5 | 7 | 6.1 | 6.4 | 4.8 | 1.8 | 70.0 |
| 31 | San Antonio | TX | South | 4.1 | 3.7 | 6.7 | 5.2 | 7.1 | 8.9 | 6.6 | 3.8 | 4.8 | 6.5 | 69.8 |
| 32 | San Diego | CA | West | 1.2 | 6.9 | 1.9 | 9.3 | 7.5 | 2.1 | 5.8 | 9.5 | 4.8 | 8.4 | 69.8 |
| 33 | Irving | TX | South | 2 | 0.6 | 6.9 | 7.5 | 5.5 | 8.9 | 9.8 | 1.3 | 4.8 | 10 | 69.7 |
| 34 | Anchorage | AK | West | 5.4 | 2 | 7.7 | 9.7 | 0.8 | 5.1 | 6.7 | 8.3 | 9.3 | 2 | 69.3 |
| 35 | Rochester | NY | Northeast | 7.3 | 9.5 | 5.6 | 0.9 | 9.8 | 2.6 | 7.4 | 1.4 | 8.5 | 3.7 | 69.0 |
| 36 | Winston Salem | NC | South | 10 | 6.1 | 7.3 | 2.7 | 4.6 | 5.6 | 3.1 | 2.8 | 8.5 | 5.9 | 68.9 |
| 37 | Louisville | KY | South | 8.9 | 2.4 | 9 | 4.5 | 2.6 | 9.7 | 1.2 | 5.3 | 7.1 | 5.7 | 68.6 |
| 38 | Salt Lake City | UT | West | 3 | 2.1 | 7.4 | 5.9 | 8.2 | 1 | 9.2 | 7.2 | 8.5 | 3.9 | 68.6 |
| 39 | Oklahoma City | OK | Midwest | 8.5 | 1.7 | 8.5 | 5.8 | 4.2 | 7.6 | 5.6 | 2.1 | 7.8 | 4.4 | 68.4 |
| 40 | Richmond | VA | South | 5.1 | 8.2 | 3.7 | 2.9 | 7.4 | 4.8 | 4.8 | 4 | 7.1 | 7.5 | 67.5 |
| 41 | San Jose | CA | West | 1.4 | 5.7 | 2.2 | 10 | 9.5 | 2.1 | 3.9 | 8.5 | 2 | 9.4 | 66.5 |
| 42 | Portland | OR | West | 3.2 | 5.5 | 4 | 8.5 | 8.9 | 2.2 | 4.2 | 7.1 | 3 | 8 | 66.4 |
| 43 | Providence | RI | Northeast | 9.3 | 7.2 | 1.8 | 1.9 | 2.6 | 4.3 | 9.6 | 5 | 6 | 6.8 | 66.3 |
| 44 | Orlando | FL | South | 4.6 | 7.8 | 3.3 | 3.8 | 7.4 | 6.4 | 8.1 | 6.1 | 3.8 | 3.1 | 66.2 |
| 45 | Corpus Christi | TX | South | 4.6 | 1.5 | 7.6 | 7 | 1.2 | 8.9 | 3.4 | 4.9 | 9.3 | 5.5 | 65.6 |
| 46 | Anaheim | CA | West | 1.7 | 9.2 | 1.4 | 9 | 3.5 | 2.1 | 6.6 | 9.4 | 2 | 9 | 65.6 |
| 47 | Santa Ana | CA | West | 2.4 | 9.8 | 1 | 7.4 | 1.7 | 2.1 | 9.7 | 8.1 | 3.8 | 7.9 | 65.6 |
| 48 | Aurora | CO | West | 3.3 | 7.6 | 5.8 | 7.9 | 9.5 | 0.9 | 6.8 | 2 | 1.7 | 8.1 | 65.2 |
| 49 | Pittsburgh | PA | Northeast | 4.2 | 3.3 | 9.7 | 3.2 | 4.2 | 4.5 | 4.4 | 8.9 | 6 | 4.9 | 64.8 |
| 50 | Sacramento | CA | West | 5.4 | 7.1 | 3.2 | 6.8 | 6.3 | 2.1 | 5.5 | 8.4 | 3.8 | 4.6 | 64.7 |
| 51 | Indianapolis | IN | Midwest | 8.2 | 6.3 | 8.9 | 3.5 | 7.4 | 3 | 5 | 3.3 | 6 | 1.4 | 64.5 |
| 52 | Wichita | KS | Midwest | 8.2 | 1.2 | 9.5 | 4.4 | 6.3 | 3.2 | 3.2 | 4.5 | 9.9 | 2.6 | 64.5 |
| 53 | Shreveport | LA | South | 9.2 | 8.2 | 5.9 | 2.2 | 1 | 10 | 2.1 | 0.6 | 9.3 | 4.1 | 64.0 |
| 54 | Milwaukee | WI | Midwest | 5.7 | 8.4 | 2.9 | 1.6 | 8 | 3.8 | 8.6 | 5.1 | 7.1 | 0.9 | 63.4 |
| 55 | Tampa | FL | South | 5.1 | 7.3 | 3.6 | 4.3 | 6.3 | 6.4 | 3.9 | 4.4 | 4.8 | 5.8 | 63.1 |
| 56 | Atlanta | GA | South | 2.8 | 4.6 | 4.7 | 5.6 | 5.5 | 9.5 | 7.8 | 6.6 | 3 | 1.6 | 62.9 |
| 57 | Scottsdale | AZ | West | 1 | 0.8 | 4.2 | 9.6 | 5.5 | 4.2 | 0.6 | 9 | 7.1 | 9.6 | 62.8 |
| 58 | Akron | OH | Midwest | 7.3 | 6.3 | 6.2 | 1.5 | 2.3 | 7.4 | 1.4 | 4.6 | 7.8 | 6.4 | 62.3 |
| 59 | Mesa | AZ | West | 6.9 | 5.1 | 6.3 | 6.1 | 5.5 | 4.2 | 1.7 | 3.1 | 3.8 | 8.3 | 62.0 |
| 60 | Henderson | NV | West | 6.5 | 1.2 | 4.6 | 9.1 | 1.5 | 3.5 | 0.9 | 8 | 6 | 9.7 | 62.0 |
| 61 | Fresno | CA | West | 6.2 | 9.6 | 2.8 | 3.1 | 0.7 | 2.1 | 8.9 | 3 | 7.1 | 6.9 | 61.3 |
| 62 | Boston | MA | Northeast | 2.1 | 4.8 | 2.7 | 8.6 | 7.1 | 0.6 | 8.3 | 9.7 | 1.6 | 4.8 | 61.2 |
| 63 | Jacksonville | FL | South | 7.6 | 6.9 | 4.4 | 5.3 | 3 | 6.4 | 2.2 | 4.2 | 4.8 | 5.4 | 61.1 |
| 64 | Memphis | TN | South | 10 | 8.6 | 2.7 | 1.8 | 3 | 7 | 5.2 | 3.9 | 7.1 | 0.8 | 60.9 |
| 65 | Reno | NV | West | 2.6 | 4 | 4.9 | 5.4 | 6.3 | 3.5 | 2.4 | 5.2 | 9.3 | 6.3 | 60.7 |
| 66 | Fort Lauderdale | FL | South | 1.5 | 8.8 | 1.1 | 6.7 | 10 | 6.4 | 0.8 | 3.2 | 3 | 7.3 | 59.4 |
| 67 | Kansas City | MO | Midwest | 7.6 | 2 | 8.2 | 4.8 | 4.2 | 6.6 | 3.3 | 3.7 | 7.1 | 1.2 | 59.2 |
| 68 | Phoenix | AZ | West | 5.1 | 4.3 | 4.8 | 5.5 | 5.5 | 4.2 | 7.3 | 1.6 | 3.8 | 6.2 | 58.8 |
| 69 | Albuquerque | NM | West | 6.2 | 6.1 | 5.1 | 5 | 3 | 7.7 | 2 | 2.3 | 7.8 | 2.9 | 58.5 |
| 70 | Cincinnati | OH | Midwest | 4.3 | 4.5 | 5.2 | 1.4 | 4.2 | 7.4 | 6.1 | 5.5 | 6 | 3.3 | 58.3 |
| 71 | Spokane | WA | West | 6.9 | 6.9 | 4.6 | 3.6 | 1 | 2.9 | 1.9 | 4.1 | 8.5 | 7.4 | 58.2 |
| 72 | Washington | DC | Northeast | 1.1 | 2.7 | 7.2 | 9.4 | 6.6 | 3.6 | 7.2 | 6.7 | 1.6 | 1.5 | 57.9 |
| 73 | Tucson | AZ | West | 5.1 | 8.2 | 4.4 | 2.1 | 4.2 | 4.2 | 4.6 | 2.4 | 7.1 | 5.3 | 57.9 |
| 74 | Tulsa | OK | Midwest | 7.3 | 1.4 | 7.9 | 3.4 | 2.6 | 7.6 | 2.9 | 0.9 | 9.9 | 3.6 | 57.8 |
| 75 | Denver | CO | West | 0.9 | 3.3 | 6.4 | 8.2 | 9.5 | 0.9 | 7.5 | 0.8 | 3.8 | 5.2 | 56.6 |
| 76 | Seattle | WA | West | 1.3 | 1 | 5.4 | 9.5 | 3 | 2.9 | 5.2 | 8.8 | 2.5 | 6 | 55.5 |
| 77 | St Petersburg | FL | South | 1.8 | 5.7 | 3.1 | 5.1 | 6.3 | 6.4 | 0.7 | 5.8 | 6 | 4.5 | 55.2 |
| 78 | Long Beach | CA | West | 1.7 | 7.5 | 1.2 | 7.7 | 3.5 | 2.1 | 6.1 | 6.8 | 1.6 | 6.7 | 54.6 |
| 79 | New Orleans | LA | South | 6.2 | 9.4 | 1.7 | 2 | 1.5 | 10 | 2.4 | 2.9 | 4.8 | 3 | 53.4 |
| 80 | Dallas | TX | South | 2 | 2 | 3.8 | 4 | 5.5 | 8.9 | 8.2 | 1.5 | 3 | 5 | 53.4 |
| 81 | Houston | TX | South | 2.8 | 3.9 | 5.1 | 4.6 | 1.9 | 8.9 | 8 | 1.8 | 2.5 | 2.8 | 51.5 |
| 82 | Los Angeles | CA | West | 0.7 | 9.4 | 0.8 | 6.6 | 3.5 | 2.1 | 5.5 | 6.3 | 1.3 | 5.6 | 50.9 |
| 83 | St Louis | MO | Midwest | 3.2 | 6.1 | 5.5 | 1.7 | 6.3 | 6.6 | 3.9 | 2.7 | 4.8 | 0.6 | 50.4 |
| 84 | New York | NY | Northeast | 2.9 | 6.9 | 0.9 | 7.8 | 4.6 | 2.6 | 2.9 | 5.4 | 0.6 | 6.6 | 50.1 |
| 85 | Chicago | IL | Midwest | 3.4 | 4.8 | 2.1 | 6 | 5.5 | 3.2 | 6.9 | 4.8 | 0.8 | 3.5 | 49.9 |
| 86 | Oakland | CA | West | 2.6 | 6.9 | 1.7 | 8.4 | 8.9 | 2.1 | 4.2 | 3.5 | 1.3 | 1.1 | 49.5 |
| 87 | Newark | NJ | Northeast | 3.8 | 8.9 | 0.6 | 1.1 | 4.6 | 9.2 | 7.9 | 1.9 | 0.7 | 1.9 | 49.4 |
| 88 | Buffalo | NY | Northeast | 4.1 | 7.5 | 8 | 1.2 | 1.7 | 2.6 | 4.7 | 1.1 | 7.8 | 1.7 | 49.1 |
| 89 | San Francisco | CA | West | 0.6 | 0.9 | 1.7 | 9.9 | 8.9 | 2.1 | 1.5 | 9.1 | 1 | 4.3 | 48.7 |
| 90 | Philadelphia | PA | Northeast | 5.7 | 8.5 | 2.5 | 2.5 | 3.5 | 4.5 | 4.6 | 4.7 | 0.9 | 2.3 | 48.3 |
| 91 | Cleveland | OH | Midwest | 8.9 | 8.4 | 2.4 | 0.7 | 1.2 | 7.4 | 1.6 | 1.7 | 4.8 | 1.3 | 46.7 |
| 92 | Las Vegas | NV | West | 6.5 | 5 | 3.5 | 6.4 | 1.5 | 3.5 | 1.8 | 2.5 | 3.8 | 3.4 | 46.1 |
| 93 | Détroit | MI | Midwest | 9.5 | 10 | 1.3 | 0.6 | 3.5 | 5 | 2.6 | 1 | 2.5 | 0.7 | 44.6 |
| 94 | Baltimore | MD | Northeast | 3.8 | 6.4 | 3 | 3.9 | 2.3 | 4.9 | 3 | 2.2 | 1.3 | 1 | 38.7 |
À propos
The Zumper Boston Metro Report analyzed active listings that hit the market last month. Listings are aggregated by city to calculate median asking rents.
In the market for a new place? Search all Boston apartments for rent on Zumper now.
Stay up to date with Zumper by following us on Facebook, Gazouillement, Instagram, & Pinterest.
Contenu associé


