The Zumper Boston Metro Report analyzed active listings in November across 16 metro cities to show the most and least expensive cities and cities with the fastest growing rents. The state median one bedroom rent was $1,893 last month.
Cities Ranked By Rent
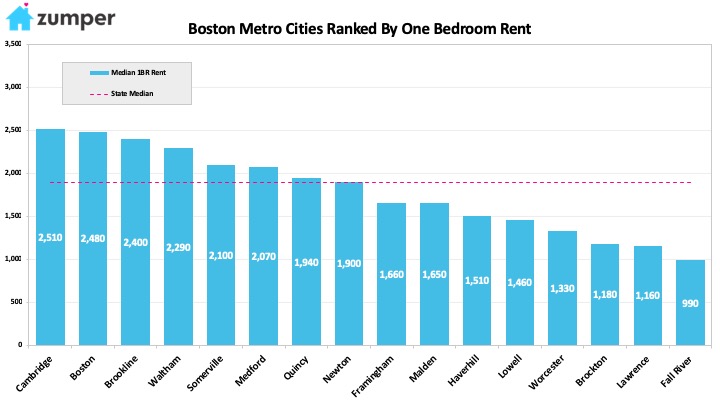
The Most Expensive Cities
–Cambridge, MA was the most expensive city to rent with one bedrooms priced at $2,510.
–Boston, Massachusetts ranked as the second priciest with rent at $2,480.
–Brookline, MA one bedroom rent was $2,400, making it third.
The Least Expensive Cities
–Fall River, MA rent was the most affordable in the metro at just under $1,000.
–Lawrence, MA was the second least expensive with rent at $1,160.
–Brockton, MA followed closely as third with rent at $1,180.
Growth Rate
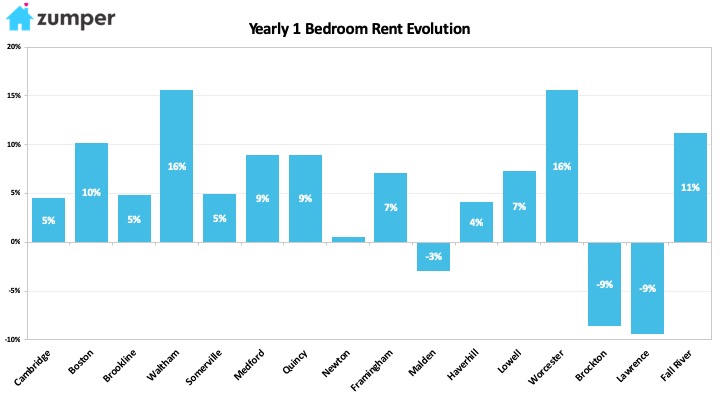
La croissance la plus rapide (Y/Y%)
–Waltham & Worcester, MA tied for the city with the largest year over year growth rate, up 15.7%.
–Fall River, MA had the second fastest growing rent, climbing 11.2% since this time last year.
–Boston, Massachusetts was third with rent jumping 10.2%.
La croissance la plus rapide (M/M%)
–Fall River, MA rent had the largest monthly growth rate, up 5.3%.
–Medford, MA followed closely behind as second with rent growing 5.1%.
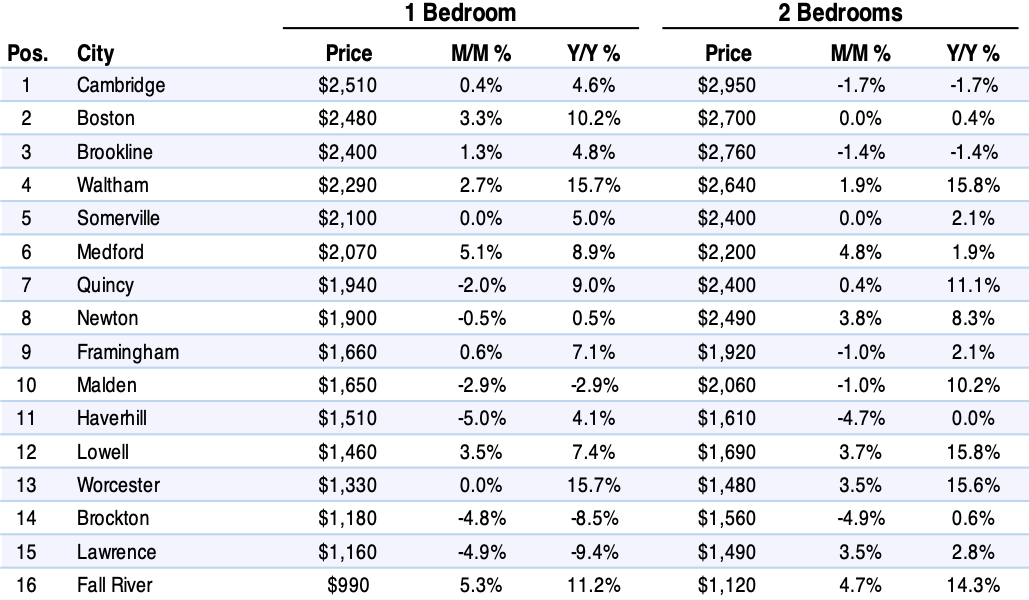
Full Data
| 1 Bedroom | 2 Bedrooms | ||||||
|---|---|---|---|---|---|---|---|
| Pos. | City | Price | M/M % | Y/Y % | Price | M/M % | Y/Y % |
| 1 | Cambridge | $2,510 | 0.40% | 4.60% | $2,950 | -1.70% | -1.70% |
| 2 | Boston | $2,480 | 3.30% | 10.20% | $2,700 | 0.00% | 0.40% |
| 3 | Brookline | $2,400 | 1.30% | 4.80% | $2,760 | -1.40% | -1.40% |
| 4 | Waltham | $2,290 | 2.70% | 15.70% | $2,640 | 1.90% | 16% |
| 5 | Somerville | $2,100 | 0.00% | 5.00% | $2,400 | 0.00% | 2% |
| 6 | Medford | $2,070 | 5.10% | 8.90% | $2,200 | 4.80% | 2% |
| 7 | Quincy | $1,940 | -2.00% | 9.00% | $2,400 | 0.40% | 11% |
| 8 | Newton | $1,900 | -0.50% | 0.50% | $2,490 | 3.80% | 8% |
| 9 | Framingham | $1,660 | 0.60% | 7.10% | $1,920 | -1.00% | 2% |
| 10 | Malden | $1,650 | -2.90% | -2.90% | $2,060 | -1.00% | 10% |
| 11 | Haverhill | $1,510 | -5.00% | 4.10% | $1,610 | -4.70% | 0% |
| 12 | Lowell | $1,460 | 3.50% | 7.40% | $1,690 | 3.70% | 16% |
| 13 | Worcester | $1,330 | 0.00% | 15.70% | $1,480 | 3.50% | 16% |
| 14 | Brockton | $1,180 | -4.80% | -8.50% | $1,560 | -4.90% | 1% |
| 15 | Lawrence | $1,160 | -4.90% | -9.40% | $1,490 | 3.50% | 3% |
| 16 | Fall River | $990 | 5.30% | 11.20% | $1,120 | 4.70% | 14% |
À propos
The Zumper Boston Metro Report analyzed active listings that hit the market last month. Listings are aggregated by city to calculate median asking rents.
In the market for a new place? Search all Boston apartments for rent on Zumper now.
Stay up to date with Zumper by following us on Facebook, Gazouillement, Instagram, & Pinterest.
Contenu associé


