The Zumper Boston Metro Report analyzed over 75,000 active listings in March across the 16 metro cities to show the most and least expensive cities and cities with the fastest growing rents.
Cities Ranked By Rent
Le plus cher
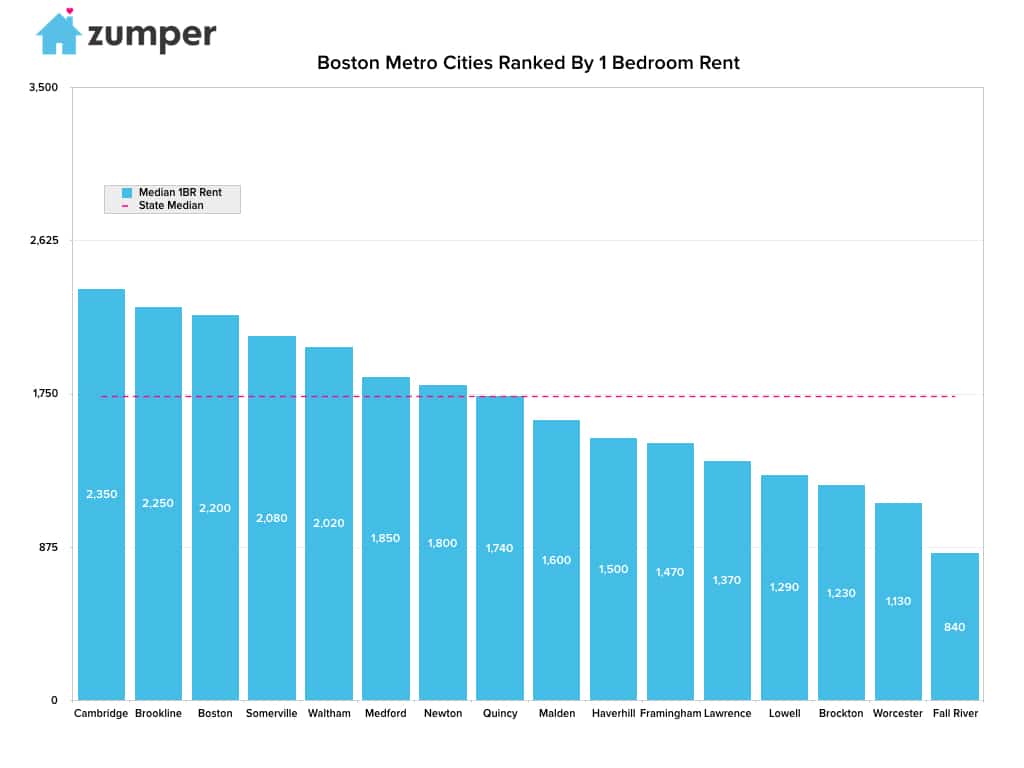
–Cambridge, MA, similar to last month, continued to reign as the most expensive city to rent this month. The price of one bedroom units here was $2,250.
–Brookline & Boston, Massachusetts were the next priciest cities with rents at $2,250 and $2,200, respectively.
–Somerville, MA outpaced Waltham, MA this month to rank as the 4th most expensive city to rent. One bedroom rent in Somerville hit $2,080 this month.
Le moins cher
–Fall River, MA rent prices dropped $10 this month, hitting a median of $840 for one bedroom units, and remained the most affordable city in the metro area.
–Worcester, MA ranked as the second least expensive city with rent at $1,130.
–Brockton, MA followed behind with the third most affordable rent.
La croissance la plus rapide (Y/Y%)
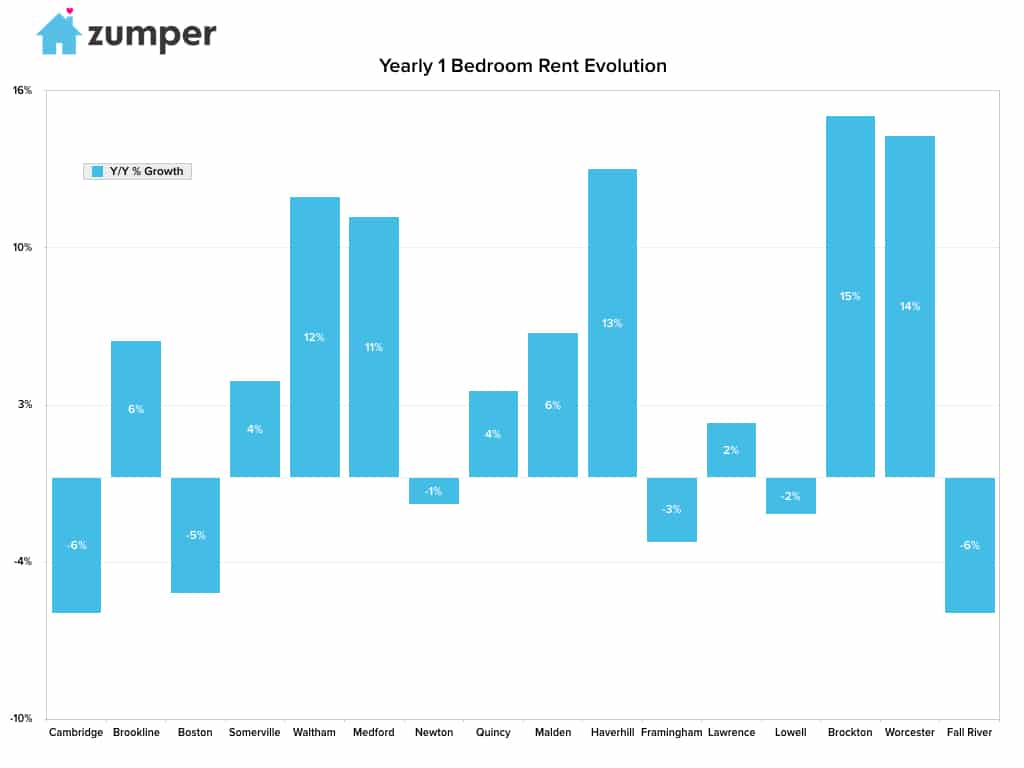
–Brockton, MA, similar to last month, had the fastest growth yearly rents, up 15%.
–Worcester, MA had the second fastest growing rents since this time last year, up 14.1%.
–Haverhill, MA ranked as third with a yearly growth rate of 12.8%.
La croissance la plus rapide (M/M%)
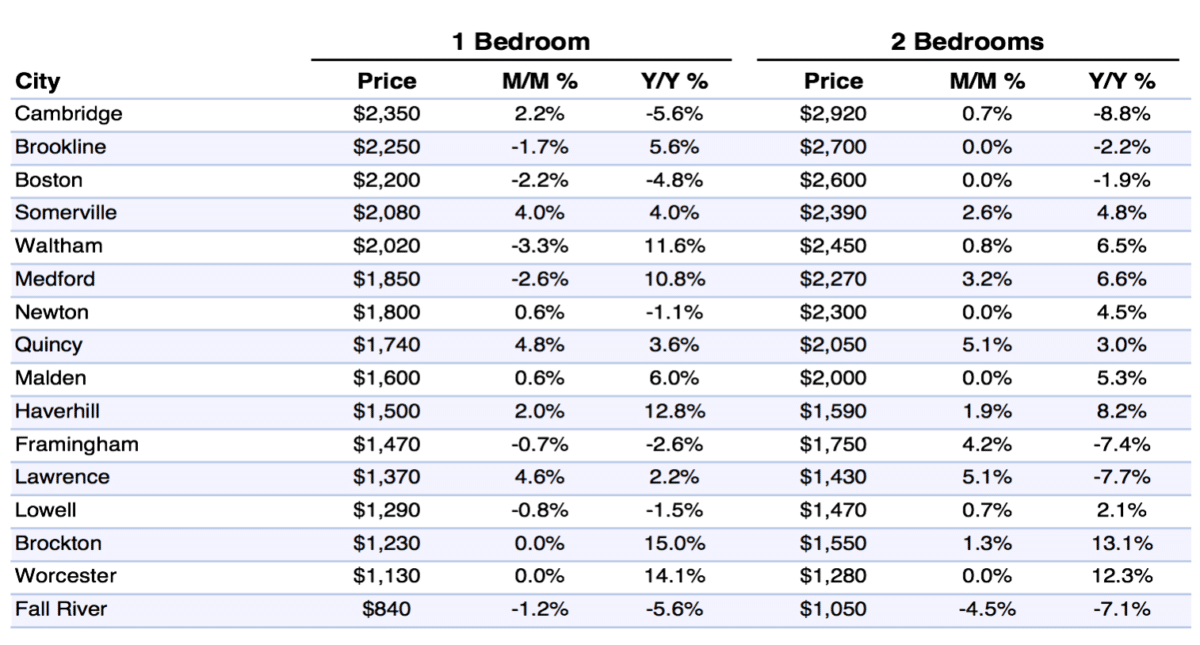
–Quincy, MA rents grew the fastest since last month, up 4.8% to $1,740.
–Lawrence, MA followed behind with a 4.6% monthly growth rate.
–Somerville, MA was third with one bedroom rent up 4% since last month.
Full Data
| One Bedroom | Two Bedrooms | ||||||
|---|---|---|---|---|---|---|---|
| Pos. | City | Price | M/M % | Y/Y % | Price | M/M % | Y/Y % |
| 1 | Minneapolis | $1,280 | -5.20% | -1.50% | $1,640 | 0.00% | -6.80% |
| 2 | Apple Valley | $1,260 | -2.30% | 14.50% | $1,290 | -1.50% | 2.40% |
| 3 | Minnetonka | $1,240 | -4.60% | 12.70% | $1,560 | -2.50% | 14.70% |
| 4 | Eagan | $1,210 | 0.00% | 11.00% | $1,220 | -3.20% | -3.20% |
| 4 | Edina | $1,210 | -3.20% | 9.00% | $1,490 | -0.70% | 8.00% |
| 5 | Woodbury | $1,200 | 5.30% | 1.70% | $1,360 | -0.70% | 0.70% |
| 6 | Plymouth | $1,150 | -3.40% | 2.70% | $1,460 | -2.70% | 4.30% |
| 7 | Eden Prairie | $1,130 | -5.00% | -4.20% | $1,360 | 0.70% | -2.20% |
| 8 | Maple Grove | $1,070 | 4.90% | 15.10% | $1,360 | 4.60% | 1.50% |
| 9 | Bloomington | $980 | 5.40% | -14.00% | $1,280 | 4.90% | 0.00% |
| 10 | Burnsville | $970 | 1.00% | -1.00% | $1,260 | 3.30% | 9.60% |
| 11 | St Paul | $900 | 2.30% | 0.00% | $1,100 | 1.90% | 1.90% |
| 12 | Coon Rapids | $840 | 1.20% | -2.30% | $1,110 | 0.90% | -3.50% |
À propos
The Zumper Boston Metro Report analyzed over 75,000 listings that hit the market in March 2017. Listings are aggregated by city to calculate median asking rents.
In the market for a new place? Search all Boston apartments for rent on Zumper now.
Stay up to date with Zumper by following us on Facebook, Gazouillement, Instagram, & Pinterest.
Contenu associé


