The first ever Zumper Columbus Metro Report analyzed active listings in July across 7 metro cities to show the most and least expensive cities and cities with the fastest growing rents. The Ohio state median one bedroom rent was $765 last month.
Cities Ranked By Rent
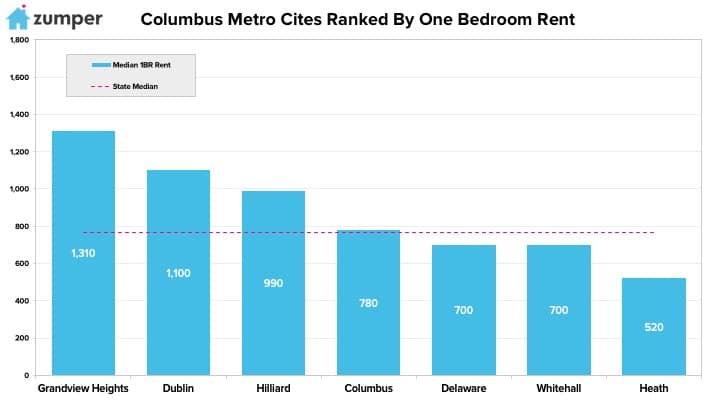
The Most Expensive
–Grandview Heights, OH remained the most expensive city in the metro with rent at $1,310.
–Dublin, OH was second with one bedrooms priced at $1,100.
–Hillard, OH stayed as third with rent at $990.
The Least Expensive
–Heath, OH saw rent grow $20 to $520, though it continued to rank as the most affordable city.
– Whitehall & Delaware, OH tied for second with prices at $700.
–Columbus, OH ranked as third with rent at $780.
Growth Rate
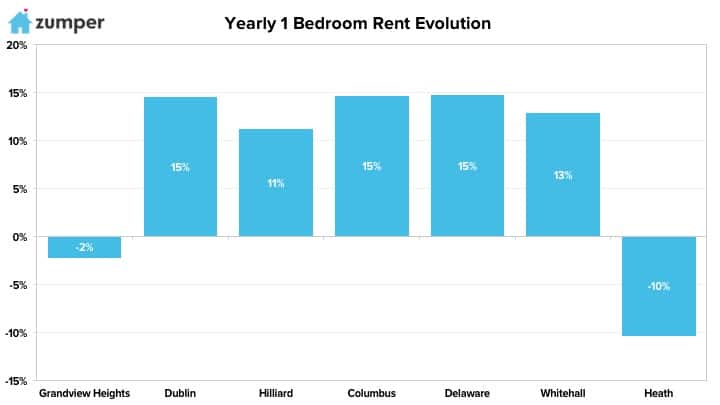
The Fastest Growing (Y/Y%)
–Delaware, OH had the fastest growing rent since this time last year, up 14.8%.
–Columbus, OH followed closely behind as second with rent jumping 14.7%.
–Dublin, OH saw rent climb 14.6%, making it third.
The Fastest Growing (M/M%)
–Heath, OH had the largest monthly rental growth rate last month, up 4%.
Full Data
| 1 Bedroom | 2 Bedrooms | ||||||
|---|---|---|---|---|---|---|---|
| Pos. | City | Price | M/M % | Y/Y % | Price | M/M % | Y/Y % |
| 1 | San Francisco, CA | $3,620 | -0.80% | 5.80% | $4,720 | -1.70% | 4.90% |
| 2 | New York, NY | $2,850 | 0.00% | -0.70% | $3,240 | -1.20% | 1.30% |
| 3 | San Jose, CA | $2,510 | 1.60% | 6.40% | $2,990 | -0.70% | 9.50% |
| 4 | Los Angeles, CA | $2,430 | 2.50% | 15.70% | $3,220 | -0.60% | 2.50% |
| 5 | Boston, MA | $2,400 | 1.70% | 9.10% | $2,700 | 0.00% | 3.40% |
| 6 | Oakland, CA | $2,250 | 3.70% | 14.80% | $2,720 | -1.10% | 6.70% |
| 7 | Washington, DC | $2,170 | 0.50% | -5.20% | $2,710 | 0.00% | -13.70% |
| 8 | San Diego, CA | $1,890 | 2.70% | 14.50% | $2,520 | 0.80% | 12.00% |
| 8 | Santa Ana, CA | $1,890 | -1.60% | -5.00% | $2,220 | -1.30% | 15.00% |
| 10 | Seattle, WA | $1,870 | -2.10% | 3.90% | $2,510 | -0.80% | 2.90% |
| 11 | Miami, FL | $1,800 | 0.00% | 2.90% | $2,400 | -1.20% | -1.20% |
| 12 | Honolulu, HI | $1,700 | 1.20% | -1.70% | $2,200 | 0.00% | 3.80% |
| 13 | Anaheim, CA | $1,690 | -1.20% | 5.60% | $2,140 | 0.90% | 6.50% |
| 14 | Long Beach, CA | $1,550 | -1.30% | 14.00% | $1,970 | -1.50% | 5.30% |
| 15 | Philadelphia, PA | $1,530 | -1.30% | 9.30% | $1,680 | -1.20% | 5.00% |
| 16 | Denver, CO | $1,510 | 0.70% | 8.60% | $1,940 | 1.60% | 10.90% |
| 17 | Chicago, IL | $1,500 | -0.70% | -2.00% | $1,850 | -0.50% | -15.10% |
| 17 | Fort Lauderdale, FL | $1,500 | 0.00% | -1.30% | $2,000 | 0.50% | 2.60% |
| 19 | Atlanta, GA | $1,480 | 1.40% | 7.20% | $1,810 | 0.00% | 7.70% |
| 19 | Providence, RI | $1,480 | 5.00% | 3.50% | $1,640 | 5.10% | 1.90% |
| 21 | Minneapolis, MN | $1,400 | -2.80% | 15.70% | $1,950 | -1.50% | 8.30% |
| 22 | Portland, OR | $1,350 | -3.60% | 0.00% | $1,640 | -1.20% | 5.10% |
| 23 | Nashville, TN | $1,330 | -1.50% | 12.70% | $1,400 | 0.70% | 7.70% |
| 24 | Baltimore, MD | $1,320 | -4.30% | 12.80% | $1,570 | -4.80% | 15.40% |
| 25 | New Orleans, LA | $1,310 | -4.40% | 0.00% | $1,450 | -2.70% | -2.00% |
| 25 | Scottsdale, AZ | $1,310 | 2.30% | 4.00% | $1,960 | -0.50% | -8.80% |
| 27 | Sacramento, CA | $1,300 | 1.60% | 13.00% | $1,450 | 2.80% | 7.40% |
| 28 | Madison, WI | $1,280 | -1.50% | 5.80% | $1,500 | 1.40% | 15.40% |
| 28 | Orlando, FL | $1,280 | 1.60% | 9.40% | $1,480 | 1.40% | 14.70% |
| 30 | Dallas, TX | $1,260 | -0.80% | -6.00% | $1,690 | -1.20% | -6.10% |
| 31 | Austin, TX | $1,210 | -1.60% | 10.00% | $1,520 | 1.30% | 10.10% |
| 32 | Houston, TX | $1,200 | -4.80% | 0.00% | $1,490 | -5.10% | -0.70% |
| 33 | Pittsburgh, PA | $1,170 | 1.70% | -4.90% | $1,370 | 1.50% | 3.00% |
| 34 | Charlotte, NC | $1,160 | 0.90% | 4.50% | $1,300 | 0.80% | 5.70% |
| 35 | Aurora, CO | $1,150 | 0.00% | 15.00% | $1,400 | -3.40% | 3.70% |
| 35 | Plano, TX | $1,150 | 0.90% | 2.70% | $1,530 | 1.30% | 2.70% |
| 35 | Tampa, FL | $1,150 | 1.80% | 8.50% | $1,350 | 0.70% | 8.00% |
| 38 | Durham, NC | $1,140 | 0.00% | 15.20% | $1,230 | -1.60% | 11.80% |
| 39 | Chandler, AZ | $1,120 | 1.80% | 12.00% | $1,320 | 0.80% | 8.20% |
| 39 | Newark, NJ | $1,120 | -5.10% | 12.00% | $1,370 | -2.80% | 14.20% |
| 41 | Irving, TX | $1,110 | -2.60% | -0.90% | $1,390 | -2.10% | 3.00% |
| 42 | Gilbert, AZ | $1,090 | -1.80% | 3.80% | $1,370 | 3.00% | 0.70% |
| 43 | Richmond, VA | $1,070 | 0.00% | 8.10% | $1,250 | 1.60% | 12.60% |
| 44 | Henderson, NV | $1,060 | -0.90% | 12.80% | $1,260 | 0.00% | 13.50% |
| 45 | Buffalo, NY | $1,050 | 1.90% | 12.90% | $1,280 | -5.20% | 13.30% |
| 46 | Fort Worth, TX | $1,040 | -2.80% | 10.60% | $1,270 | -0.80% | 5.80% |
| 46 | St Petersburg, FL | $1,040 | -1.00% | 15.60% | $1,470 | -3.30% | 15.70% |
| 48 | Chesapeake, VA | $1,030 | -1.00% | 15.70% | $1,200 | 0.00% | 1.70% |
| 48 | Salt Lake City, UT | $1,030 | -1.00% | 15.70% | $1,450 | 5.10% | 16.00% |
| 50 | Virginia Beach, VA | $1,020 | 0.00% | -1.00% | $1,200 | 0.00% | 0.80% |
| 51 | Jacksonville, FL | $1,010 | 5.20% | 12.20% | $1,100 | 0.90% | 5.80% |
| 52 | Raleigh, NC | $1,000 | 0.00% | 3.10% | $1,170 | 0.90% | 8.30% |
| 53 | Milwaukee, WI | $990 | 2.10% | 15.10% | $1,070 | -3.60% | 15.10% |
| 54 | Boise, ID | $960 | 4.30% | 15.70% | $1,040 | 1.00% | 11.80% |
| 54 | Fresno, CA | $960 | 0.00% | 15.70% | $1,110 | 1.80% | 12.10% |
| 56 | Phoenix, AZ | $950 | 0.00% | 11.80% | $1,200 | 0.80% | 10.10% |
| 57 | Kansas City, MO | $930 | -1.10% | 12.00% | $1,070 | 0.90% | 7.00% |
| 58 | Las Vegas, NV | $920 | 0.00% | 15.00% | $1,120 | 0.00% | 14.30% |
| 59 | Colorado Springs, CO | $910 | 0.00% | 13.80% | $1,090 | -0.90% | -0.90% |
| 60 | Anchorage, AK | $900 | 0.00% | 0.00% | $1,150 | 0.00% | 4.50% |
| 60 | Corpus Christi, TX | $900 | 3.40% | 4.70% | $1,080 | 0.90% | 8.00% |
| 62 | Reno, NV | $890 | 4.70% | 14.10% | $1,260 | 5.00% | 15.60% |
| 63 | Louisville, KY | $880 | 4.80% | -2.20% | $1,020 | 0.00% | 6.30% |
| 64 | Laredo, TX | $870 | 4.80% | 14.50% | $980 | -1.00% | 11.40% |
| 64 | San Antonio, TX | $870 | -5.40% | 4.80% | $1,100 | -4.30% | 7.80% |
| 66 | Mesa, AZ | $860 | 0.00% | 7.50% | $1,030 | 1.00% | 12.00% |
| 67 | Baton Rouge, LA | $830 | 0.00% | 1.20% | $930 | -2.10% | 5.70% |
| 67 | Syracuse, NY | $830 | 1.20% | -8.80% | $960 | -5.00% | 1.10% |
| 69 | Cleveland, OH | $820 | 3.80% | 15.50% | $870 | 0.00% | 16.00% |
| 69 | Des Moines, IA | $820 | -1.20% | 15.50% | $930 | 3.30% | 13.40% |
| 69 | Rochester, NY | $820 | 0.00% | 15.50% | $980 | -3.00% | 15.30% |
| 72 | Arlington, TX | $800 | -1.20% | 15.90% | $1,070 | -0.90% | 15.10% |
| 72 | Omaha, NE | $800 | -3.60% | 0.00% | $1,040 | -4.60% | 9.50% |
| 74 | Chattanooga, TN | $780 | 0.00% | 11.40% | $890 | 4.70% | 15.60% |
| 74 | Cincinnati, OH | $780 | 0.00% | 14.70% | $1,120 | -0.90% | 15.50% |
| 74 | Knoxville, TN | $780 | -3.70% | 14.70% | $910 | -2.20% | 15.20% |
| 74 | Norfolk, VA | $780 | -3.70% | 14.70% | $930 | -1.10% | 4.50% |
| 78 | Winston Salem, NC | $770 | -1.30% | 14.90% | $840 | -4.50% | 15.10% |
| 79 | Glendale, AZ | $760 | -1.30% | 13.40% | $940 | -1.10% | 0.00% |
| 79 | St Louis, MO | $760 | 0.00% | 15.20% | $1,060 | -2.80% | 15.20% |
| 81 | Lexington, KY | $750 | -1.30% | 5.60% | $950 | 3.30% | 5.60% |
| 81 | Memphis, TN | $750 | 2.70% | 15.40% | $800 | 1.30% | 14.30% |
| 81 | Spokane, WA | $750 | 5.60% | 5.60% | $940 | 4.40% | 9.30% |
| 84 | Columbus, OH | $730 | -5.20% | 7.40% | $1,070 | 0.00% | 10.30% |
| 84 | Tallahassee, FL | $730 | 0.00% | 15.90% | $870 | 0.00% | 11.50% |
| 86 | Augusta, GA | $710 | -5.30% | 14.50% | $810 | -2.40% | 5.20% |
| 86 | Bakersfield, CA | $710 | -5.30% | 2.90% | $900 | 4.70% | 4.70% |
| 86 | Greensboro, NC | $710 | -1.40% | 12.70% | $820 | -1.20% | 5.10% |
| 86 | Oklahoma City, OK | $710 | -1.40% | 9.20% | $860 | -1.10% | 8.90% |
| 90 | Indianapolis, IN | $690 | 4.50% | 15.00% | $830 | 3.80% | 15.30% |
| 90 | Lincoln, NE | $690 | -1.40% | 15.00% | $970 | 1.00% | 12.80% |
| 92 | Albuquerque, NM | $660 | -1.50% | 3.10% | $830 | -1.20% | 1.20% |
| 93 | El Paso, TX | $640 | 0.00% | 6.70% | $770 | 2.70% | 4.10% |
| 93 | Tucson, AZ | $640 | 1.60% | 1.60% | $820 | -3.50% | 2.50% |
| 95 | Lubbock, TX | $630 | 1.60% | 14.50% | $770 | 0.00% | 10.00% |
| 95 | Shreveport, LA | $630 | -1.60% | 12.50% | $700 | -2.80% | 12.90% |
| 95 | Tulsa, OK | $630 | 0.00% | 6.80% | $780 | -2.50% | 8.30% |
| 98 | Wichita, KS | $600 | -1.60% | 15.40% | $760 | 2.70% | 15.20% |
| 99 | Detroit, MI | $580 | -3.30% | 5.50% | $680 | -2.90% | 4.60% |
| 100 | Akron, OH | $550 | 0.00% | 1.90% | $700 | 0.00% | 7.70% |
About
The Zumper DC Metro Report analyzed active listings that hit the market last month. Listings are aggregated by city to calculate median asking rents.
In the market for a new place? Search all Columbus apartments for rent on Zumper now.
Stay up to date with Zumper by following us on Facebook, Twitter, Instagram, & Pinterest.
Related content


