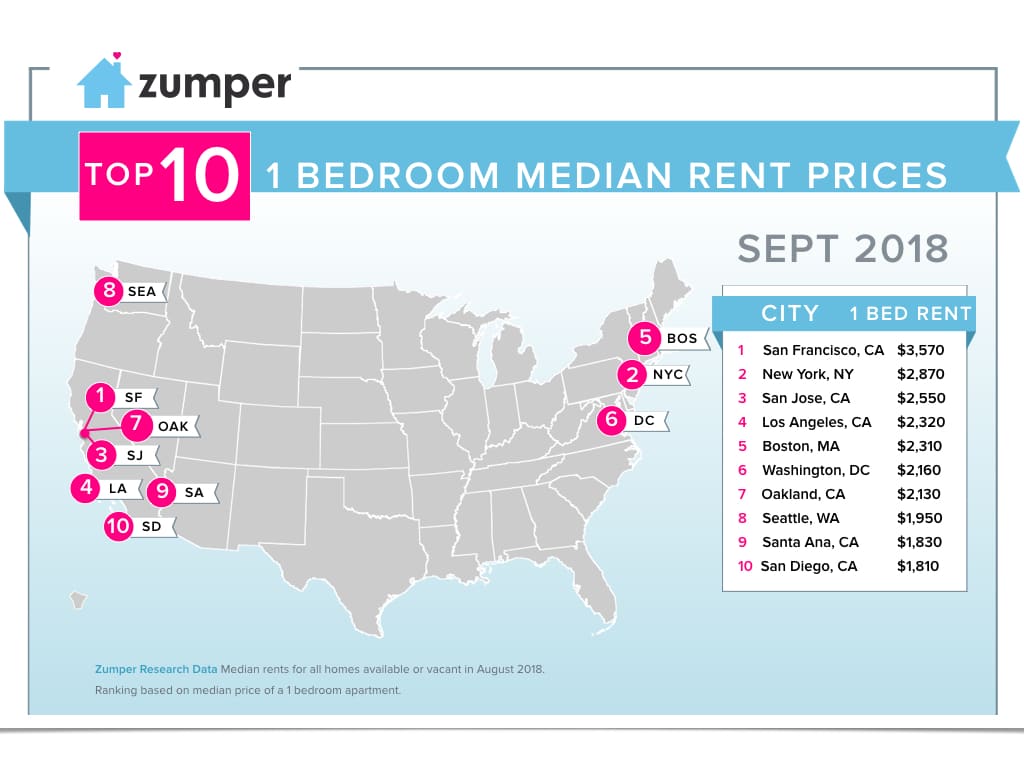
Last month, the top 10 markets saw a shake up as Santa Ana, for the first time, moved in as the 9th most expensive city, pushing Miami down to 11th. This means that it’s bad news for the Golden State as more than half of the top markets, 6 of 10, are California cities. The lower-tiered markets had both the largest rental growth rate and the biggest rent dip of the month. Winston Salem, currently 75th, saw one bedroom rent climb 5.3%, while Akron, the most affordable city, saw rent drop 5.3%.
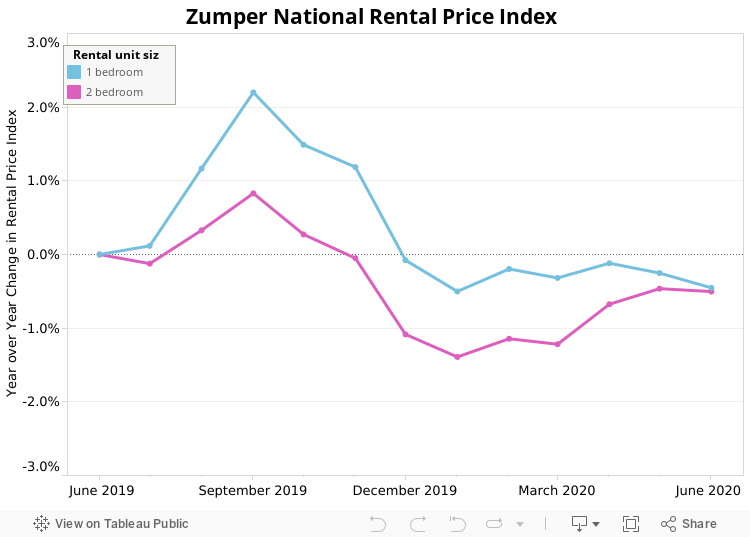
Overall, the national one and two bedroom median rents had flat monthly growth rates. Both bedroom types increased a slight 0.1% last month, with one bedroom rent settling at $1,209 and two bedroom rent at $1,447. On a year over year basis, one and two bedroom prices are up 2.2% and 3.2%, respectively.
Les cinq principaux marchés locatifs
1. San Francisco, Californie one bedroom rent, remaining the most expensive in the nation, saw a small uptick of 2% to $3,570, while two bedrooms decreased 0.6% to $4,700.
2. New York, NY saw one bedroom rent decrease 1% to $2,870, while two bedrooms fell 0.6% to $3,270.
3. San José, Californie had a flat month with one bedroom rent staying stable at $2,550 and two bedrooms dropping 1.3% to $2,970.
4. Los Angeles, Californie moved up one spot, outpacing Boston, to become the 4th priciest city with one and two bedroom prices settling at $2,320 and $3,200, respectively.
5. Boston, Massachusetts dropped to 5th with one bedroom rent falling 1.3% to $2,310 and two bedroom rent decreasing 1.8% to $2,700.
Changements notables ce mois-ci
 Vers le haut
–Santa Ana, Californie rose two spots and, for the first time ever, ranked in the top 10 markets as the 8th priciest city. One bedroom rent grew 3.4%, which was the largest monthly growth rate in the top cities, to $1,830, while two bedrooms remained flat at $2,140.
–Providence, Rhode Island moved up 3 positions to become the 20th most expensive. One bedroom rent jumped 5.1% to $1,440, while two bedrooms were stable at $1,520.
–Sacramento, Californie shot up 4 spots to become 27th with one bedroom rent growing 5% to $1,260. Two bedrooms saw a smaller bump, increasing 3.5% to $1,460.
–Winston-Salem, Caroline du Nord one bedroom rent saw an 8 ranking jump to 75th, thanks to the 5.3% monthly growth rate, which was the largest in the country.
–Détroit, Michigan saw one bedroom rent climb 5%, settling at $630, and up 4 spots to become the 94th priciest city. Two bedrooms saw growth as well, with rent increasing 4.3% to $720.
 Vers le bas
–Portland, Oregon fell 3 spots to become the 22nd priciest city with one bedroom rent decreasing 5.1% to $1,440.
–Saint-Pétersbourg, Floride moved down 2 spots, now ranking as the 50th most expensive city, with one bedroom rent down 2.9% to $1,010.
–Syracuse, New York saw one bedroom rent drop 4.6%, settling at $830, and down 4 positions to rank as 68th. Two bedroom rent took an even larger dip, falling 5.4% to $1,060.
–Lexington, Kentucky took a 5 ranking plunge to 83rd with one bedrooms rent falling 5.1% to $750. Two bedroom rent had a more moderate decline, down 3.2% to $910.
–Akron, Ohio one bedroom rent, remaining the least expensive, had the largest monthly decrease in the country, falling 5.3% to $540. Two bedrooms saw a smaller drop, down 1.3% to $740.
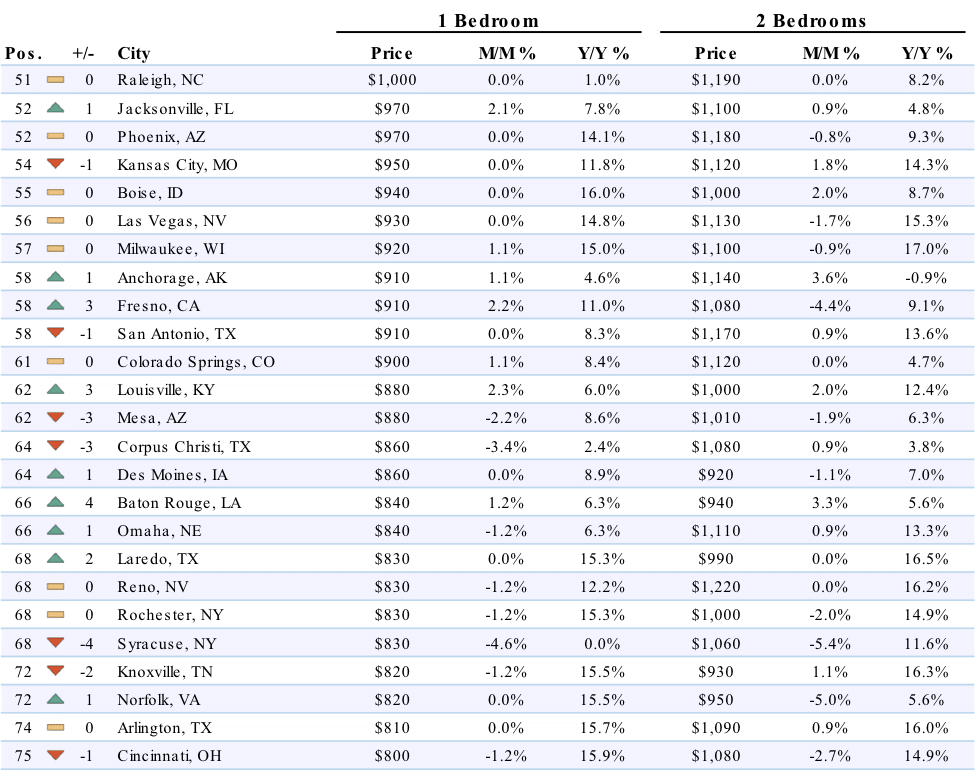
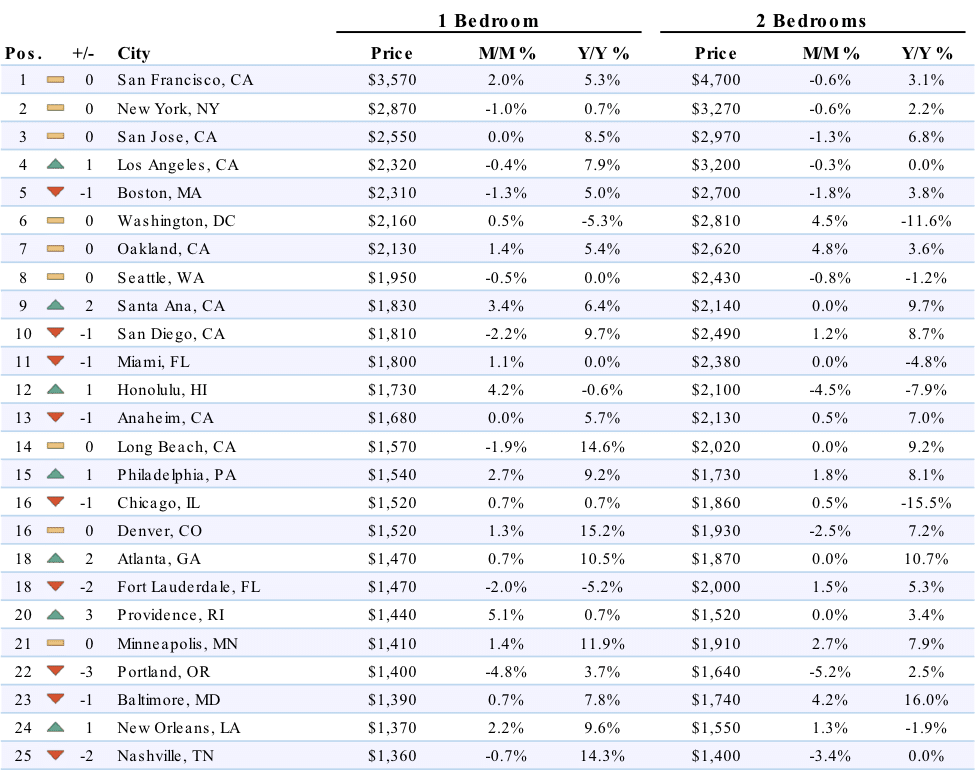
Données complètes
| 1 chambre | 2 chambres | ||||||
|---|---|---|---|---|---|---|---|
| Pos. | Ville | Prix | M/M % | Y/Y % | Prix | M/M % | Y/Y % |
| 1 | San Francisco, Californie | $3,570 | 2.00% | 5.30% | $4,700 | -0.60% | 3.10% |
| 2 | New York, NY | $2,870 | -1.00% | 0.70% | $3,270 | -0.60% | 2.20% |
| 3 | San José, Californie | $2,550 | 0.00% | 8.50% | $2,970 | -1.30% | 6.80% |
| 4 | Los Angeles, Californie | $2,320 | -0.40% | 7.90% | $3,200 | -0.30% | 0.00% |
| 5 | Boston, Massachusetts | $2,310 | -1.30% | 5.00% | $2,700 | -1.80% | 3.80% |
| 6 | Washington, D.C. | $2,160 | 0.50% | -5.30% | $2,810 | 4.50% | -11.60% |
| 7 | Oakland, Californie | $2,130 | 1.40% | 5.40% | $2,620 | 4.80% | 3.60% |
| 8 | Seattle, WA | $1,950 | -0.50% | 0.00% | $2,430 | -0.80% | -1.20% |
| 9 | Santa Ana, Californie | $1,830 | 3.40% | 6.40% | $2,140 | 0.00% | 9.70% |
| 10 | San Diego, Californie | $1,810 | -2.20% | 9.70% | $2,490 | 1.20% | 8.70% |
| 11 | Miami, Floride | $1,800 | 1.10% | 0.00% | $2,380 | 0.00% | -4.80% |
| 12 | Honolulu, Hawaï | $1,730 | 4.20% | -0.60% | $2,100 | -4.50% | -7.90% |
| 13 | Anaheim, Californie | $1,680 | 0.00% | 5.70% | $2,130 | 0.50% | 7.00% |
| 14 | Long Beach, Californie | $1,570 | -1.90% | 14.60% | $2,020 | 0.00% | 9.20% |
| 15 | Philadelphie, Pennsylvanie | $1,540 | 2.70% | 9.20% | $1,730 | 1.80% | 8.10% |
| 16 | Chicago, Illinois | $1,520 | 0.70% | 0.70% | $1,860 | 0.50% | -15.50% |
| 16 | Denver, Colorado | $1,520 | 1.30% | 15.20% | $1,930 | -2.50% | 7.20% |
| 18 | Atlanta, Géorgie | $1,470 | 0.70% | 10.50% | $1,870 | 0.00% | 10.70% |
| 18 | Fort Lauderdale, Floride | $1,470 | -2.00% | -5.20% | $2,000 | 1.50% | 5.30% |
| 20 | Providence, Rhode Island | $1,440 | 5.10% | 0.70% | $1,520 | 0.00% | 3.40% |
| 21 | Minneapolis, Minnesota | $1,410 | 1.40% | 11.90% | $1,910 | 2.70% | 7.90% |
| 22 | Portland, Oregon | $1,400 | -4.80% | 3.70% | $1,640 | -5.20% | 2.50% |
| 23 | Baltimore, Maryland | $1,390 | 0.70% | 7.80% | $1,740 | 4.20% | 16.00% |
| 24 | Nouvelle-Orléans, Louisiane | $1,370 | 2.20% | 9.60% | $1,550 | 1.30% | -1.90% |
| 25 | Nashville, Tennessee | $1,360 | -0.70% | 14.30% | $1,400 | -3.40% | 0.00% |
| 26 | Madison, Wisconsin | $1,290 | 0.80% | 7.50% | $1,410 | -0.70% | 13.70% |
| 27 | Dallas, Texas | $1,260 | -3.10% | -7.40% | $1,710 | -3.90% | -9.00% |
| 27 | Houston, Texas | $1,260 | -1.60% | 13.50% | $1,600 | 0.00% | 16.80% |
| 27 | Sacramento, Californie | $1,260 | 5.00% | 11.50% | $1,460 | 3.50% | 13.20% |
| 30 | Orlando, Floride | $1,240 | -0.80% | 12.70% | $1,460 | 1.40% | 16.80% |
| 30 | Scottsdale, Arizona | $1,240 | -1.60% | 3.30% | $1,900 | -2.60% | -9.50% |
| 32 | Austin, Texas | $1,200 | 0.80% | 9.10% | $1,490 | 0.70% | 6.40% |
| 33 | Tampa, Floride | $1,170 | 0.90% | 11.40% | $1,390 | 0.70% | 13.00% |
| 34 | Charlotte, Caroline du Nord | $1,150 | -2.50% | 2.70% | $1,290 | 0.00% | 4.90% |
| 34 | Plano, Texas | $1,150 | -2.50% | 0.00% | $1,560 | -0.60% | 0.60% |
| 36 | Aurora, Colorado | $1,140 | 0.00% | 14.00% | $1,440 | -1.40% | 3.60% |
| 37 | Durham, Caroline du Nord | $1,130 | 0.00% | 10.80% | $1,270 | -3.10% | 15.50% |
| 38 | Newark, NJ | $1,120 | 0.00% | 12.00% | $1,390 | 0.00% | 15.80% |
| 38 | Pittsburgh, Pennsylvanie | $1,120 | 2.80% | -11.10% | $1,350 | 0.70% | 1.50% |
| 40 | Irving, Texas | $1,110 | -2.60% | -6.70% | $1,460 | -5.20% | -0.70% |
| 41 | Gilbert, Arizona | $1,080 | 0.00% | 2.90% | $1,340 | 0.00% | 3.90% |
| 42 | Henderson, Nevada | $1,070 | 0.90% | 11.50% | $1,260 | 1.60% | 16.70% |
| 42 | Virginia Beach, Virginie | $1,070 | 3.90% | 4.90% | $1,220 | 1.70% | 1.70% |
| 44 | Fort Worth, Texas | $1,060 | -3.60% | 9.30% | $1,330 | 1.50% | 15.70% |
| 44 | Richmond, Virginie | $1,060 | 1.00% | 5.00% | $1,240 | -0.80% | 3.30% |
| 46 | Buffalo, New York | $1,050 | -2.80% | 10.50% | $1,420 | 1.40% | 13.60% |
| 46 | Chandler, Arizona | $1,050 | 0.00% | 7.10% | $1,290 | 0.80% | 7.50% |
| 48 | Chesapeake, Virginie | $1,040 | -1.00% | 15.60% | $1,200 | 0.00% | 0.00% |
| 48 | Salt Lake City, Utah | $1,040 | 0.00% | 15.60% | $1,350 | 0.00% | 15.40% |
| 50 | Saint-Pétersbourg, Floride | $1,010 | -2.90% | 9.80% | $1,520 | 1.30% | 15.20% |
| 51 | Raleigh, Caroline du Nord | $1,000 | 0.00% | 1.00% | $1,190 | 0.00% | 8.20% |
| 52 | Jacksonville, Floride | $970 | 2.10% | 7.80% | $1,100 | 0.90% | 4.80% |
| 52 | Phoenix, Arizona | $970 | 0.00% | 14.10% | $1,180 | -0.80% | 9.30% |
| 54 | Kansas City, Missouri | $950 | 0.00% | 11.80% | $1,120 | 1.80% | 14.30% |
| 55 | Boise, Idaho | $940 | 0.00% | 16.00% | $1,000 | 2.00% | 8.70% |
| 56 | Las Vegas, Nevada | $930 | 0.00% | 14.80% | $1,130 | -1.70% | 15.30% |
| 57 | Milwaukee, Wisconsin | $920 | 1.10% | 15.00% | $1,100 | -0.90% | 17.00% |
| 58 | Anchorage, Alaska | $910 | 1.10% | 4.60% | $1,140 | 3.60% | -0.90% |
| 58 | Fresno, Californie | $910 | 2.20% | 11.00% | $1,080 | -4.40% | 9.10% |
| 58 | San Antonio, Texas | $910 | 0.00% | 8.30% | $1,170 | 0.90% | 13.60% |
| 61 | Colorado Springs, Colorado | $900 | 1.10% | 8.40% | $1,120 | 0.00% | 4.70% |
| 62 | Louisville, Kentucky | $880 | 2.30% | 6.00% | $1,000 | 2.00% | 12.40% |
| 62 | Mesa, Arizona | $880 | -2.20% | 8.60% | $1,010 | -1.90% | 6.30% |
| 64 | Corpus Christi, Texas | $860 | -3.40% | 2.40% | $1,080 | 0.90% | 3.80% |
| 64 | Des Moines, Iowa | $860 | 0.00% | 8.90% | $920 | -1.10% | 7.00% |
| 66 | Baton Rouge, Louisiane | $840 | 1.20% | 6.30% | $940 | 3.30% | 5.60% |
| 66 | Omaha, NE | $840 | -1.20% | 6.30% | $1,110 | 0.90% | 13.30% |
| 68 | Laredo, Texas | $830 | 0.00% | 15.30% | $990 | 0.00% | 16.50% |
| 68 | Reno, Nevada | $830 | -1.20% | 12.20% | $1,220 | 0.00% | 16.20% |
| 68 | Rochester, New York | $830 | -1.20% | 15.30% | $1,000 | -2.00% | 14.90% |
| 68 | Syracuse, New York | $830 | -4.60% | 0.00% | $1,060 | -5.40% | 11.60% |
| 72 | Knoxville, Tennessee | $820 | -1.20% | 15.50% | $930 | 1.10% | 16.30% |
| 72 | Norfolk, Virginie | $820 | 0.00% | 15.50% | $950 | -5.00% | 5.60% |
| 74 | Arlington, Texas | $810 | 0.00% | 15.70% | $1,090 | 0.90% | 16.00% |
| 75 | Cincinnati, Ohio | $800 | -1.20% | 15.90% | $1,080 | -2.70% | 14.90% |
| 75 | Columbus, Ohio | $800 | 2.60% | 14.30% | $1,050 | -0.90% | 15.40% |
| 75 | Winston-Salem, Caroline du Nord | $800 | 5.30% | 15.90% | $840 | 0.00% | 15.10% |
| 78 | Saint-Louis, Missouri | $790 | -1.30% | 16.20% | $1,130 | -3.40% | 16.50% |
| 79 | Cleveland, Ohio | $780 | -2.50% | 16.40% | $880 | -2.20% | 15.80% |
| 80 | Chattanooga, Tennessee | $770 | 0.00% | 8.50% | $810 | 0.00% | 8.00% |
| 80 | Glendale, Arizona | $770 | 0.00% | 14.90% | $1,000 | -2.90% | 12.40% |
| 82 | Bakersfield, Californie | $760 | -2.60% | 11.80% | $890 | 0.00% | 1.10% |
| 83 | Lexington, Kentucky | $750 | -5.10% | -5.10% | $910 | -3.20% | -2.20% |
| 83 | Memphis, Tennessee | $750 | 1.40% | 13.60% | $800 | 2.60% | 14.30% |
| 85 | Spokane, Washington | $740 | -2.60% | 13.80% | $900 | -4.30% | 9.80% |
| 86 | Greensboro, Caroline du Nord | $730 | 0.00% | 10.60% | $820 | -2.40% | -2.40% |
| 86 | Tallahassee, Floride | $730 | 0.00% | 15.90% | $860 | 1.20% | 7.50% |
| 88 | Oklahoma City, Oklahoma | $720 | 1.40% | 14.30% | $860 | 2.40% | 10.30% |
| 89 | Augusta, Géorgie | $710 | -1.40% | 9.20% | $830 | 0.00% | 5.10% |
| 89 | Lincoln, NE | $710 | -2.70% | 10.90% | $960 | 0.00% | 15.70% |
| 91 | Albuquerque, Nouveau-Mexique | $670 | 3.10% | 6.30% | $830 | -1.20% | 3.80% |
| 91 | Indianapolis, Indiana | $670 | -1.50% | 13.60% | $800 | -1.20% | 15.90% |
| 93 | Shreveport, Louisiane | $640 | 0.00% | 12.30% | $720 | -2.70% | 10.80% |
| 94 | Détroit, Michigan | $630 | 5.00% | 14.50% | $720 | 4.30% | 14.30% |
| 94 | El Paso, Texas | $630 | 0.00% | 1.60% | $770 | 1.30% | 4.10% |
| 94 | Tucson, Arizona | $630 | 0.00% | -3.10% | $850 | 0.00% | 0.00% |
| 94 | Tulsa, Oklahoma | $630 | 3.30% | 6.80% | $780 | 1.30% | 5.40% |
| 98 | Lubbock, Texas | $620 | 3.30% | 12.70% | $770 | -1.30% | 2.70% |
| 99 | Wichita, Kansas | $600 | -1.60% | 13.20% | $770 | 2.70% | 16.70% |
| 100 | Akron, Ohio | $540 | -5.30% | 0.00% | $740 | -1.30% | 12.10% |
À propos
Le rapport national Zumper sur les loyers analyse les données locatives de plus d'un million d'annonces actives aux États-Unis. Les données sont agrégées mensuellement afin de calculer le loyer médian demandé pour les 100 principales agglomérations (par population), offrant ainsi une vision complète de l'état actuel du marché. Ce rapport s'appuie sur toutes les données disponibles au cours du mois précédant sa publication.
Si vous souhaitez une explication plus détaillée de la façon dont nous calculons nos données de loyer et des raisons de ce calcul, consultez notre méthodologie post.
Pour rester informé(e) des variations de loyer dans tout le pays, aimez ou suivez Zumper sur Facebook, Gazouillement, et Instagram. Vous cherchez un nouveau logement ? Rechercher appartements à louer sur Zumper.
Contenu associé