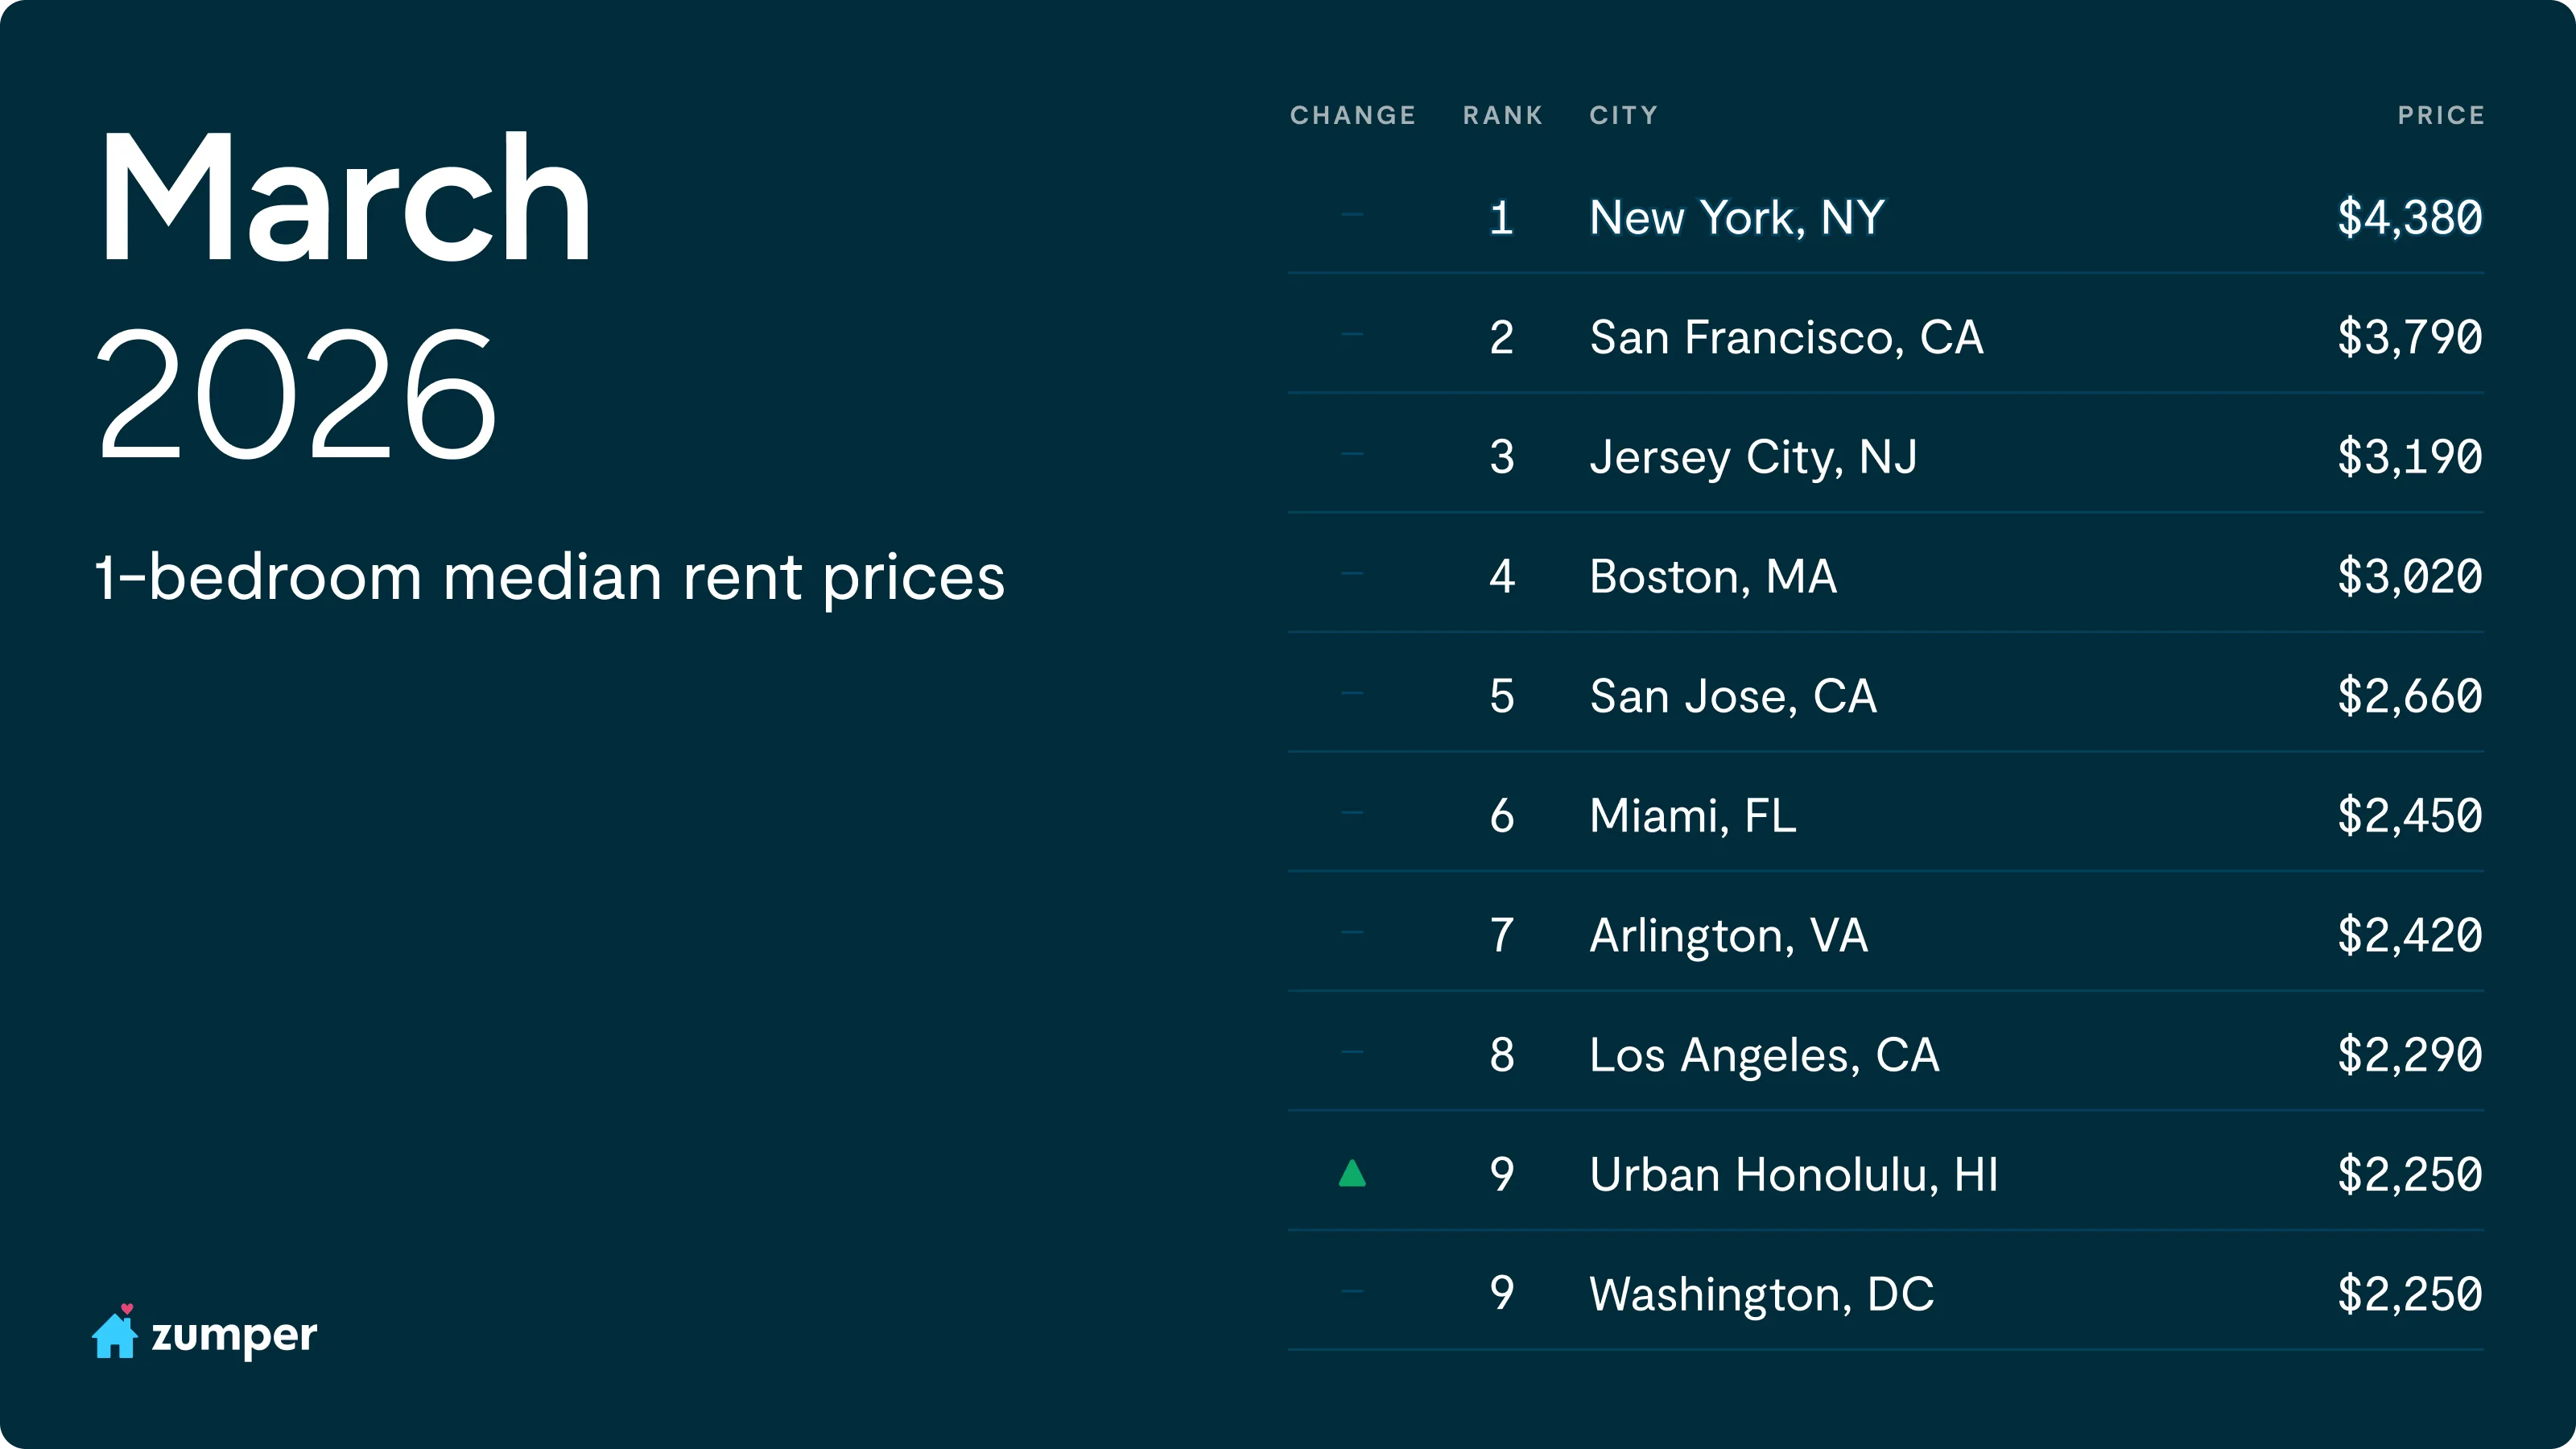
In the rent-versus-buy debate, only local markets can show a true answer. Two main figures explain it, derived from Zumper’s median rent data and NAR’s median home prices.
The first number is the price-to-rent ratio: a market’s median home price divided by a year’s median rent. A common rule of thumb is that a score of above 21 favors renting, below 15 favors buying, and anything between is essentially a toss-up. Across 80+ markets we analyzed, the national midpoint is about 20.
The second is the PITI cost delta: the gap between a monthly mortgage payment (principal, interest, taxes, and insurance) and what it costs to rent the same month. It answers the more immediate question of whether you bought today, how much more (or less) would you hand over each month than a renter down the street?
Before diving into the numbers, we looked at 16 markets where the two key metrics reveal distinct trends.
Where renting wins big
These markets have the highest price-to-rent ratios. Home prices outpaced rents, giving renting a clear near-term advantage.
1. San Jose, CA: the most lopsided market in America. With a median home price of $2,030,000 against an all-bedroom median rent of $3,073, San Jose’s price-to-rent ratio is 55.0, which is more than double the national midpoint and the highest of any market we analyzed. Buying here costs roughly $8,593 more per month than renting.
2. Anaheim, CA. Anaheim posts a 47.8 ratio, with a $1,442,900 median price and $2,514 rent. The ownership premium: about $5,702 a month.
3. Salt Lake City, UT. The highest ratio outside the coasts. At a $576,500 median price and $1,378 rent, Salt Lake’s 34.9 ratio shows how significantly home values have outrun rents in the Mountain West. The monthly ownership premium is roughly $1,928.
4. Seattle, WA. A $772,600 median price and $1,972 rent put Seattle at 32.6, with owning costing about $2,575 more per month.
5. Portland, OR. Nearly identical math to Seattle: a $585,800 price and $1,506 rent yield a 32.4 ratio and a ~$2,077 monthly premium for buyers.
6. San Diego, CA. A $1,050,000 median price against $2,818 rent puts San Diego at 31.1. Even with some of the highest rents in the country, home prices climb faster, and owning costs about $3,208 more per month than renting.
7. Reno, NV. Often overlooked, Reno’s $602,900 median price against $1,735 rent lands at 29.0. Still firmly in rent-favorable territory, with a ~$1,662 monthly gap.
8. San Francisco, CA. The Bay Area’s other heavyweight. A $1,350,000 median price and $3,926 rent, the highest median rent on this list, still produce a 28.7 ratio, with owning running about $3,832 more per month than renting.
9. Los Angeles, CA. A $858,500 median price against $2,670 rent gives LA a 26.8 ratio and a ~$2,325 monthly ownership premium. Proof that even where rents are steep, buying remains the pricier monthly choice.
Two surprises in the middle of the country
10. Boise, ID. The pandemic boomtown story in one number. Boise’s median price of $484,000 against $1,450 rent gives it a 27.8 ratio, right alongside coastal heavyweights like San Francisco and Los Angeles, and a sign of how quickly prices outpaced rents here. Owning costs about $1,418 more per month.
11. Milwaukee, WI. A genuine outlier for the Midwest. With a $417,900 median price and just $1,299 rent, Milwaukee’s 26.8 ratio matches Los Angeles almost exactly. Rents haven’t kept pace with home values. The monthly ownership premium is roughly $1,687.
Where buying can make more sense
At the other end, these markets carry the lowest price-to-rent ratios. Rents are high relative to home prices, so the monthly math leans toward owning.
12. Syracuse, NY: the most buy-favorable market in our data. A $249,700 median price against $1,650 rent produces a 12.6 ratio, the lowest of any market analyzed. And the monthly gap is tiny: owning costs only about $237 more than renting.
13. Pittsburgh, PA. A near-perfect tie. At a $234,600 median price and $1,500 rent, Pittsburgh’s 13.0 ratio comes with the smallest ownership premium in the entire dataset, about $1 a month. For practical purposes, renting and buying cost the same here.
14. New York, NY. A reminder that “expensive” and “buy-favorable” aren’t opposites. New York’s $750,000 median price looks steep, but the median rent of $4,400 is steeper still, producing a 14.2 ratio. The monthly ownership premium is just ~$194.
15. Charleston, SC. A $459,500 median price against $2,590 rent gives Charleston a 14.8 ratio and a modest ~$165 monthly gap between owning and renting.
16. New Orleans, LA. Rounding out the buy-favorable group, New Orleans pairs a $293,800 median price with $1,650 rent for a 14.8 ratio. Owning costs only about $204 more per month than renting.
The PITI cost delta: where owning barely costs more than renting
The price-to-rent ratio measures value, while the PITI delta measures cash flow. When the gap between a mortgage payment and rent shrinks toward zero, the case for buying gets a lot easier to make because you’re paying roughly the same either way, with one path building equity.
A few markets reach near cash-flow parity: owning and renting costs differ by only a few hundred dollars a month.
- Pittsburgh, PA: about $1/month. Owning and renting cost effectively the same.
- Charleston, SC: about $165/month.
- New York, NY: about $194/month.
- New Orleans, LA: about $204/month.
- Virginia Beach, VA: about $234/month.
- Syracuse, NY: about $237/month.
- Buffalo, NY: about $286/month.
Most parity markets also have the lowest price-to-rent ratios.
In the priciest markets, the PITI delta balloons into thousands of dollars a month, the cost of buying in instead of renting:
- San Jose, CA: about $8,593/month more to own.
- Anaheim, CA: about $5,702/month.
- San Francisco, CA: about $3,832/month.
- Urban Honolulu, HI: about $3,633/month.
- San Diego, CA: about $3,208/month.
In San Jose, a buyer pays an entire extra mortgage’s worth of money each month versus a renter.
The rent-vs-buy question doesn’t have a national answer because the math changes depending on your ZIP code. For example, in San Jose, renting saves more than $8,500 a month, and the price-to-rent ratio sits at a staggering 55. By contrast, in Pittsburgh, the two options cost the same. Most of the country falls somewhere in between, so your best move depends on where you call home.
Données complètes
| Ville | Price to rent ratio | NAR median house price | Zumper annualized rent | Monthly homeowner cost (PITI) | Zumper monthly all-bed rent | Cost delta (PITI) |
|---|---|---|---|---|---|---|
| San José, Californie | 55.049 | $2,030,000 | $36,876 | $11,666 | $3,073 | $8,593 |
| Anaheim, Californie | 47.829 | $1,442,900 | $30,168 | $8,216 | $2,514 | $5,702 |
| Honolulu (Hawaï) | 36.717 | $1,175,100 | $32,004 | $6,300 | $2,667 | $3,633 |
| Salt Lake City, Utah | 34.863 | $576,500 | $16,536 | $3,306 | $1,378 | $1,928 |
| Seattle, WA | 32.649 | $772,600 | $23,664 | $4,547 | $1,972 | $2,575 |
| Portland, Oregon | 32.415 | $585,800 | $18,072 | $3,583 | $1,506 | $2,077 |
| San Diego, Californie | 31.05 | $1,050,000 | $33,816 | $6,026 | $2,818 | $3,208 |
| Reno, Nevada | 28.958 | $602,900 | $20,820 | $3,397 | $1,735 | $1,662 |
| San Francisco, Californie | 28.655 | $1,350,000 | $47,112 | $7,758 | $3,926 | $3,832 |
| Boise, Idaho | 27.816 | $484,000 | $17,400 | $2,868 | $1,450 | $1,418 |
| Denver, Colorado | 27.434 | $641,300 | $23,376 | $4,004 | $1,948 | $2,056 |
| Milwaukee, Wisconsin | 26.809 | $417,900 | $15,588 | $2,986 | $1,299 | $1,687 |
| Los Angeles, Californie | 26.795 | $858,500 | $32,040 | $4,995 | $2,670 | $2,325 |
| Spokane, Washington | 26.41 | $412,000 | $15,600 | $2,516 | $1,300 | $1,216 |
| Tucson, Arizona | 26.325 | $391,400 | $14,868 | $2,481 | $1,239 | $1,242 |
| Des Moines, Iowa | 26.077 | $311,200 | $11,934 | $2,352 | $995 | $1,357 |
| Newark, NJ | 25.875 | $683,100 | $26,400 | $4,680 | $2,200 | $2,480 |
| Sacramento, Californie | 25.231 | $545,000 | $21,600 | $3,250 | $1,800 | $1,450 |
| Phoenix, Arizona | 24.87 | $479,600 | $19,284 | $2,952 | $1,607 | $1,345 |
| Augusta, Géorgie | 24.34 | $379,700 | $15,600 | $2,457 | $1,300 | $1,157 |
| Madison, Wisconsin | 23.715 | $468,700 | $19,764 | $3,234 | $1,647 | $1,587 |
| Richmond, Virginie | 23.709 | $450,800 | $19,014 | $2,801 | $1,585 | $1,217 |
| Colorado Springs, Colorado | 23.542 | $459,500 | $19,518 | $2,796 | $1,627 | $1,170 |
| Albuquerque, Nouveau-Mexique | 22.61 | $359,500 | $15,900 | $2,324 | $1,325 | $999 |
| Fresno, Californie | 22.466 | $430,000 | $19,140 | $2,584 | $1,595 | $989 |
| Anchorage, Alaska | 22.407 | $484,000 | $21,600 | $3,067 | $1,800 | $1,267 |
| Jersey City, New Jersey | 22.321 | $750,000 | $33,600 | $4,863 | $2,800 | $2,063 |
| Las Vegas, Nevada | 22.295 | $481,700 | $21,606 | $2,763 | $1,801 | $962 |
| Lincoln, NE | 21.819 | $295,600 | $13,548 | $2,370 | $1,129 | $1,241 |
| Washington, D.C. | 21.67 | $637,100 | $29,400 | $3,666 | $2,450 | $1,216 |
| Minneapolis, Minnesota | 21.654 | $388,600 | $17,946 | $2,729 | $1,496 | $1,233 |
| Baltimore, Maryland | 21.464 | $412,100 | $19,200 | $2,781 | $1,600 | $1,181 |
| Kansas City, Missouri | 21.414 | $346,900 | $16,200 | $2,387 | $1,350 | $1,037 |
| Jacksonville, Floride | 21.339 | $390,000 | $18,276 | $2,424 | $1,523 | $901 |
| Raleigh, Caroline du Nord | 21.04 | $440,200 | $20,922 | $2,744 | $1,744 | $1,001 |
| Austin, Texas | 20.956 | $460,200 | $21,960 | $3,163 | $1,830 | $1,333 |
| Providence, Rhode Island | 20.821 | $524,700 | $25,200 | $3,370 | $2,100 | $1,270 |
| Winston-Salem, Caroline du Nord | 20.622 | $321,700 | $15,600 | $2,109 | $1,300 | $809 |
| Omaha, NE | 20.4 | $308,700 | $15,132 | $2,493 | $1,261 | $1,232 |
| Asheville, Caroline du Nord | 20.271 | $447,100 | $22,056 | $2,761 | $1,838 | $923 |
| Chattanooga, Tennessee | 20.042 | $336,700 | $16,800 | $2,277 | $1,400 | $877 |
| Tulsa, Oklahoma | 19.935 | $275,100 | $13,800 | $2,218 | $1,150 | $1,069 |
| Durham, Caroline du Nord | 19.929 | $418,500 | $21,000 | $2,656 | $1,750 | $906 |
| Baton Rouge, Louisiane | 19.891 | $274,500 | $13,800 | $1,697 | $1,150 | $547 |
| Bakersfield, Californie | 19.784 | $397,300 | $20,082 | $2,481 | $1,674 | $808 |
| Memphis, Tennessee | 19.769 | $290,600 | $14,700 | $2,084 | $1,225 | $859 |
| Columbus, Ohio | 19.651 | $341,700 | $17,388 | $2,274 | $1,449 | $825 |
| Philadelphie, Pennsylvanie | 19.592 | $381,100 | $19,452 | $2,387 | $1,621 | $766 |
| Louisville, Kentucky | 19.406 | $283,400 | $14,604 | $1,948 | $1,217 | $731 |
| Miami, Floride | 19.345 | $650,000 | $33,600 | $4,000 | $2,800 | $1,200 |
| Orlando, Floride | 19.298 | $440,000 | $22,800 | $2,758 | $1,900 | $859 |
| Indianapolis, Indiana | 19.253 | $322,300 | $16,740 | $2,120 | $1,395 | $725 |
| Wichita, Kansas | 19.221 | $229,500 | $11,940 | $1,838 | $995 | $843 |
| Charlotte, Caroline du Nord | 19.141 | $417,000 | $21,786 | $2,547 | $1,816 | $732 |
| Tallahassee, Floride | 19.071 | $330,000 | $17,304 | $2,141 | $1,442 | $699 |
| Shreveport, Louisiane | 18.52 | $227,800 | $12,300 | $1,446 | $1,025 | $421 |
| Cincinnati, Ohio | 18.243 | $310,200 | $17,004 | $2,095 | $1,417 | $678 |
| Détroit, Michigan | 18.126 | $260,900 | $14,394 | $1,882 | $1,200 | $683 |
| Boston, Massachusetts | 18.123 | $747,900 | $41,268 | $4,294 | $3,439 | $855 |
| Akron, Ohio | 18.106 | $217,600 | $12,018 | $1,562 | $1,002 | $561 |
| Saint-Louis, Missouri | 18.051 | $281,600 | $15,600 | $1,981 | $1,300 | $681 |
| Nashville, Tennessee | 17.952 | $405,100 | $22,566 | $2,600 | $1,881 | $720 |
| Knoxville, Tennessee | 17.936 | $363,100 | $20,244 | $2,379 | $1,687 | $692 |
| Greensboro, Caroline du Nord | 17.933 | $297,400 | $16,584 | $1,986 | $1,382 | $604 |
| Oklahoma City, Oklahoma | 17.811 | $264,600 | $14,856 | $2,371 | $1,238 | $1,133 |
| Houston, Texas | 17.374 | $331,500 | $19,080 | $2,747 | $1,590 | $1,157 |
| Tampa, Floride | 17.125 | $400,000 | $23,358 | $2,516 | $1,947 | $570 |
| Lexington, Kentucky | 16.946 | $284,700 | $16,800 | $1,960 | $1,400 | $560 |
| San Antonio, Texas | 16.823 | $302,200 | $17,964 | $2,261 | $1,497 | $764 |
| Dallas, Texas | 16.55 | $369,000 | $22,296 | $2,842 | $1,858 | $984 |
| New Haven, Connecticut | 16.453 | $407,500 | $24,768 | $2,997 | $2,064 | $933 |
| Atlanta, Géorgie | 16.28 | $370,200 | $22,740 | $2,436 | $1,895 | $541 |
| Cleveland, Ohio | 15.757 | $226,900 | $14,400 | $1,645 | $1,200 | $445 |
| Buffalo, New York | 15.631 | $262,600 | $16,800 | $1,686 | $1,400 | $286 |
| El Paso, Texas | 14.912 | $272,000 | $18,240 | $2,246 | $1,520 | $726 |
| Virginia Beach, Virginie | 14.898 | $362,200 | $24,312 | $2,260 | $2,026 | $234 |
| Nouvelle-Orléans, Louisiane | 14.838 | $293,800 | $19,800 | $1,854 | $1,650 | $204 |
| Rochester, New York | 14.836 | $252,800 | $17,040 | $1,896 | $1,420 | $476 |
| Charleston, Caroline du Sud | 14.787 | $459,500 | $31,074 | $2,754 | $2,590 | $165 |
| Chicago, Illinois | 14.549 | $384,100 | $26,400 | $2,726 | $2,200 | $526 |
| New York, NY | 14.205 | $750,000 | $52,800 | $4,594 | $4,400 | $194 |
| Pittsburgh, Pennsylvanie | 13.033 | $234,600 | $18,000 | $1,501 | $1,500 | $1 |
| Syracuse, New York | 12.611 | $249,700 | $19,800 | $1,887 | $1,650 | $237 |
Méthodologie
To find the cities where renting makes more financial sense than buying in 2026, we analyzed the 83 largest U.S. cities through two lenses: the price-to-rent ratio et le monthly cost delta, the real dollar gap between the monthly housing costs of owning vs. renting your home.
Price-to-rent ratio
The price-to-rent ratio is a standard measure of whether a housing market favors buyers or renters. We calculated it for each city as:
Price-to-Rent Ratio = Median Home Sale Price ÷ (Median Monthly Rent × 12)
The higher the ratio, the more expensive it is to buy relative to renting. Conventionally, a ratio above 20 signals that renting is the smarter financial move, and a ratio above 25 indicates a strong renter’s market where buying is especially hard to justify on cost alone.
Monthly cost delta
The price-to-rent ratio tells you which way a market leans, but not what it costs in real dollars. To answer that, we estimated the monthly cost of owning the median-priced home in each city and compared it directly to the median monthly rent.
Our monthly homeownership cost combines three components:
- Mortgage principal and interest — We assumed a standard 20% down payment on the NAR median sale price and financed the remaining 80% over a 30-year term at the Freddie Mac weekly average 30-year fixed rate (6.49% as of 6/25/2026), then amortized that loan to a monthly payment.
- Impôts fonciers — We derived each city’s effective property tax rate from Census data (see footnote 1), applied it to the NAR median sale price to estimate annual property taxes, and divided that by 12 to get the monthly property tax cost.
- Homeowners insurance — We used NerdWallet’s average monthly homeowners insurance cost for each location.
Subtracting median rent from this monthly ownership cost gives the delta — for example, “in Los Angeles, CA, buying the median home costs $2,325 more per month than renting.”
Data sources
Voici les sources des données pour chaque indicateur :
- Loyer médian : Rapport national sur les loyers de Zumper — median monthly rent across all bedroom types (all-bed median) per city.
- Median Home Sale Price: National Association of Realtors (NAR): Metropolitan Median Area Prices and Affordability — used for both the price-to-rent ratio and as the home-price basis for the monthly mortgage and property-tax calculations.
- 30-Year Fixed Mortgage Rate: Freddie Mac Primary Mortgage Market Survey, via Federal Reserve Economic Data (FRED): 30-Year Fixed Rate Mortgage Average in the United States (MORTGAGE30US) — weekly average at time of publication.
- Homeowners Insurance: NerdWallet: Average Homeowners Insurance Cost — average monthly premium by location, used in the monthly cost delta.
- Median Home Value (for property tax estimation): U.S. Census Bureau: American Community Survey, Table B25077 – Median Value (Dollars) (2024, 5-Year Estimates).
- Median Real Estate Taxes Paid (for property tax estimation): U.S. Census Bureau: American Community Survey, Table B25103 – Mortgage Status by Median Real Estate Taxes Paid (Dollars) (2024, 5-Year Estimates).
Footnotes
- To estimate 2026 property taxes, we calculated each city’s effective property tax rate by dividing median real estate taxes paid (ACS Table B25103) by the median home value (ACS Table B25077). We then applied that rate to the current NAR median sale price to estimate annual property taxes, and divided by 12 for a monthly figure. This lets us project a forward-looking tax estimate anchored to today’s home prices rather than to the older assessed values embedded in the raw Census figures.
- We used a 20% down payment as the standard assumption throughout. Beyond being the conventional benchmark, a 20% down payment also avoids private mortgage insurance (PMI), which keeps the monthly ownership estimate clean and comparable across locations.
- We used the ACS 2024 5-Year Estimates for the property-tax inputs because they provide the most current and accurate available reading. Our monthly homeownership cost estimates reflect mortgage principal and interest, property taxes, and homeowners insurance; it does not include HOA dues, maintenance, or closing costs, which vary widely by property and buyer.
Ce produit utilise l'API de données du Bureau du recensement, mais n'est ni approuvé ni certifié par le Bureau du recensement.
Contenu associé